
The PyTorch Compiler Was a Black Box. depyf Finally Opens It.
Researchers from Tsinghua University, Apple, and UC Berkeley built a tool that translates PyTorch’s internal bytecode back into readable Python — making torch.compile something you can actually understand, debug, and optimize with confidence.
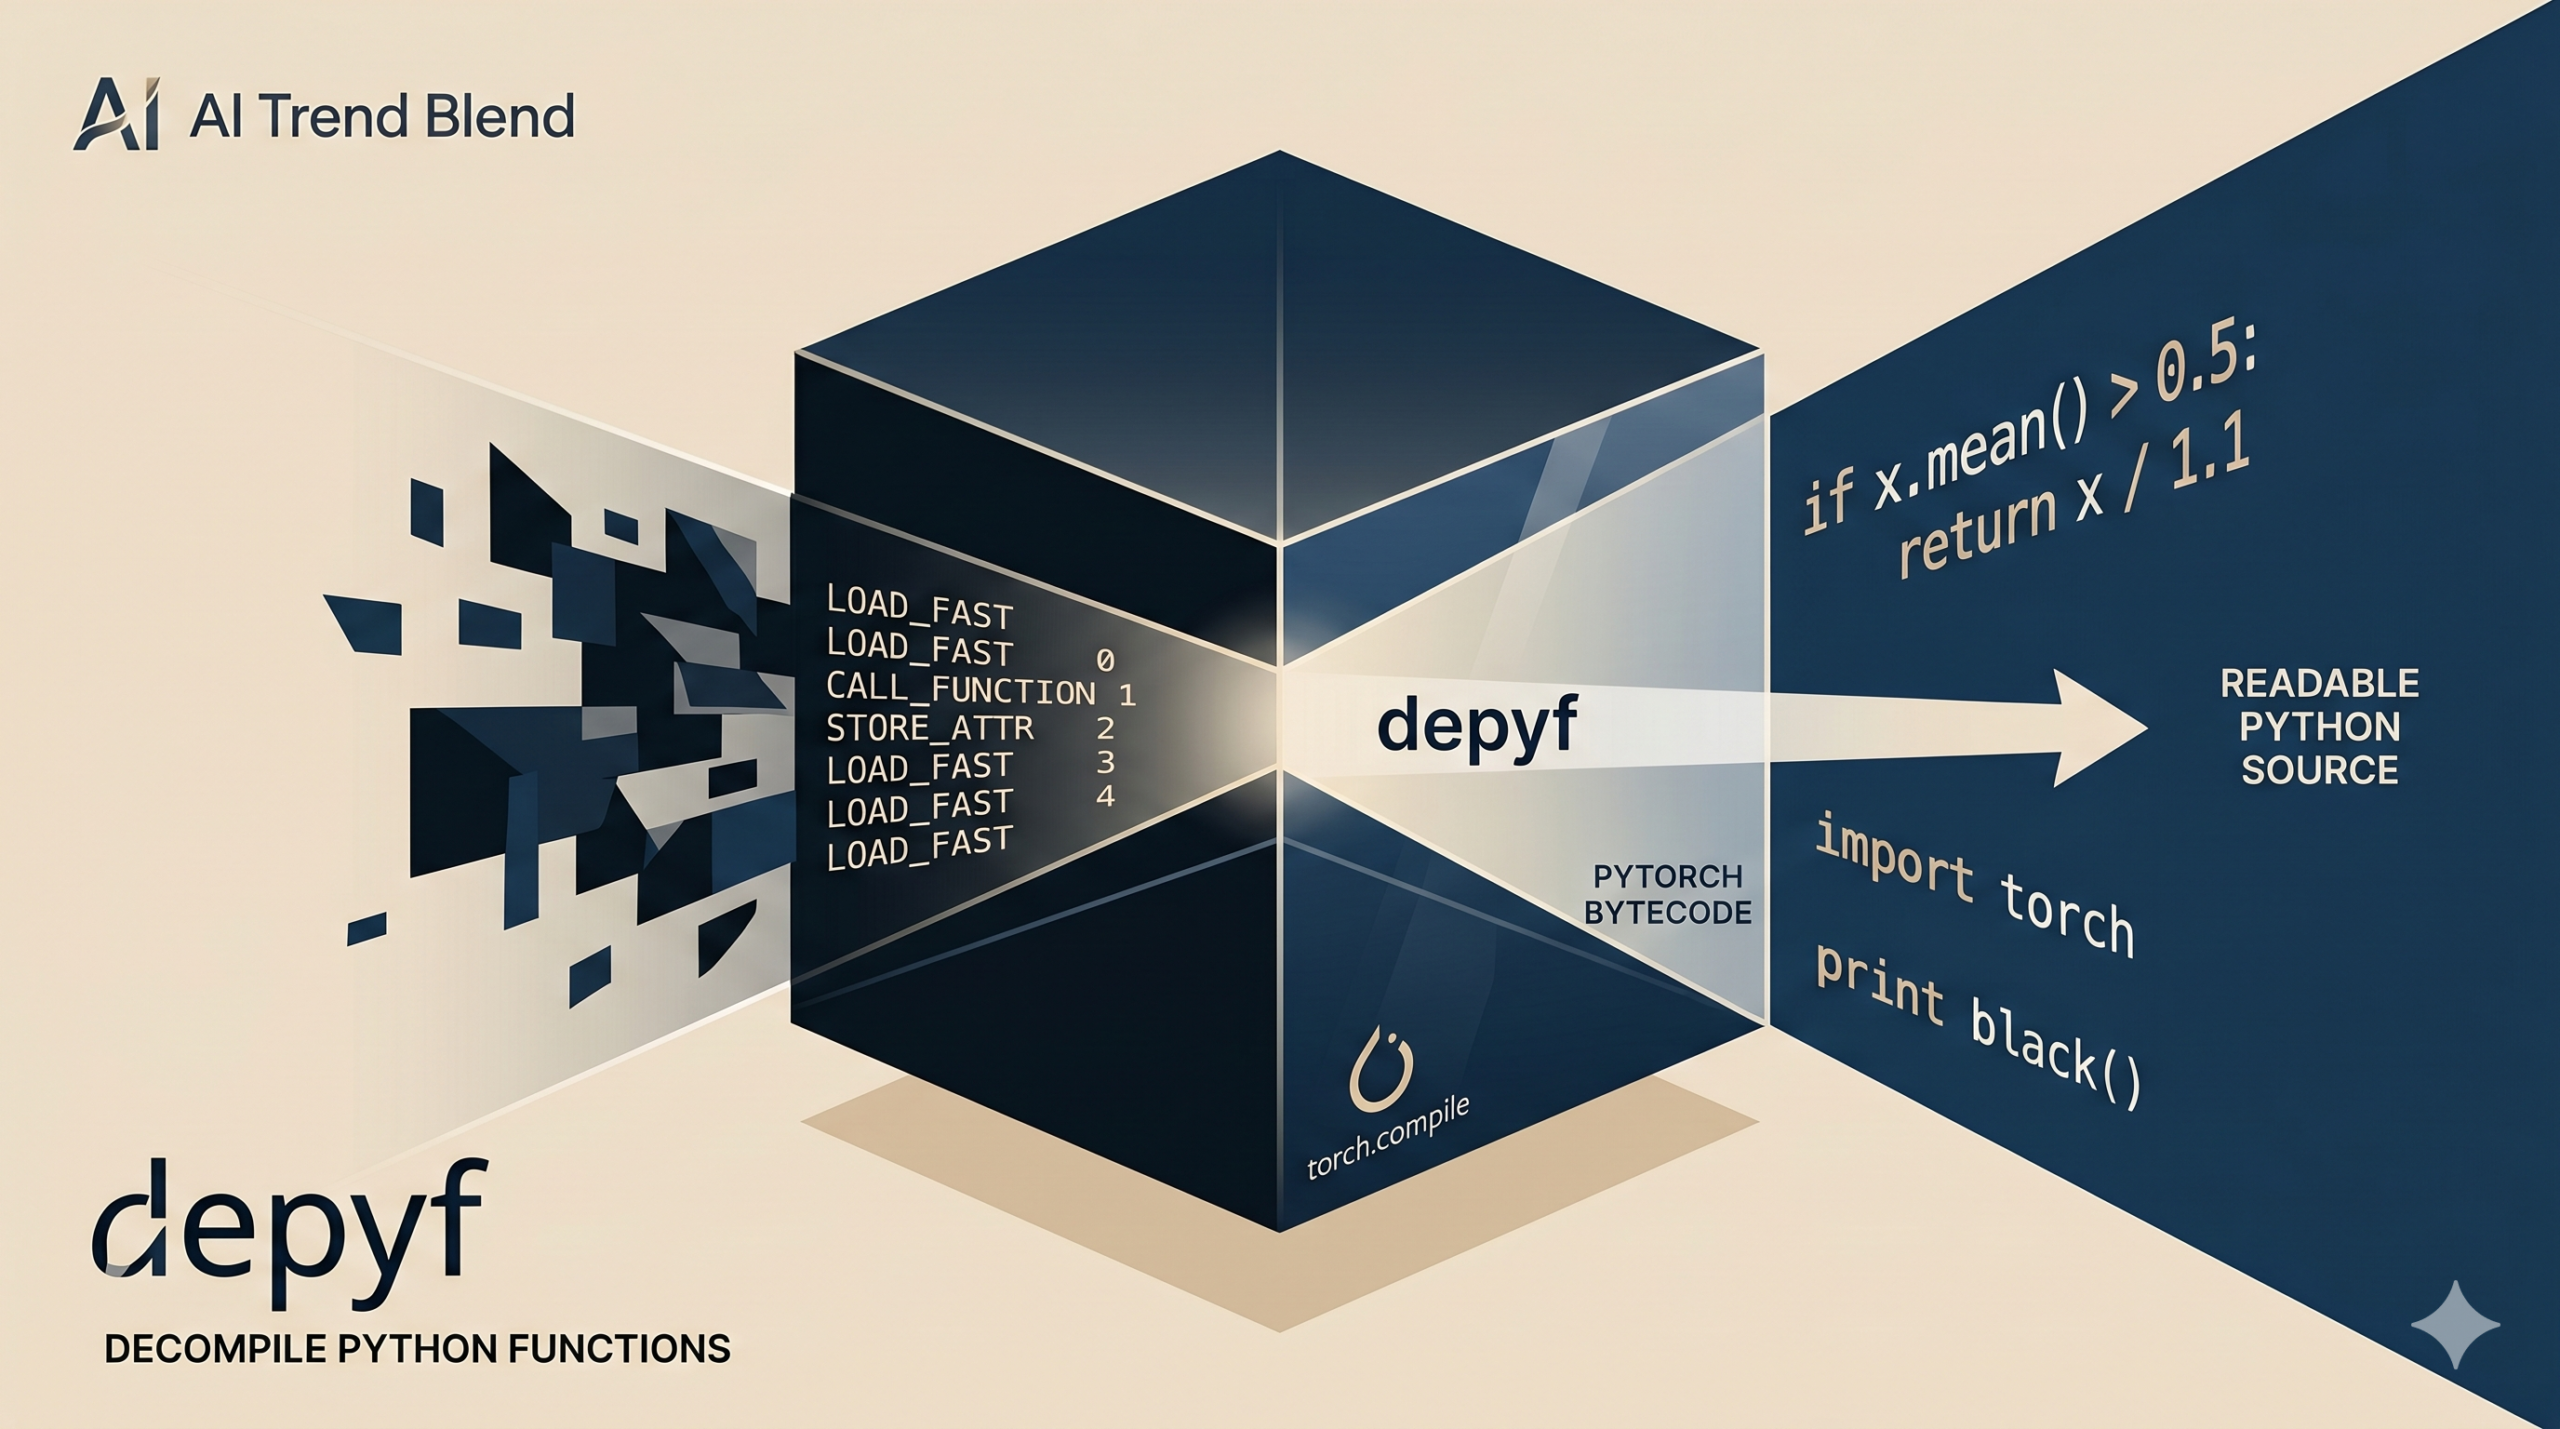
If you have ever tried to optimize a neural network with torch.compile and hit a wall — a NaN error you cannot trace, a graph break you cannot explain, a performance regression with no obvious cause — you already know the frustration this paper is about. PyTorch 2.x brought a powerful compiler, but it operates at the Python bytecode level, which is invisible to ordinary debuggers and almost incomprehensible to anyone who is not a compiler engineer. Kaichao You, Runsheng Bai, Meng Cao, Jianmin Wang, Ion Stoica, and Mingsheng Long have built the missing tool: depyf. Published in JMLR 2025, it converts bytecode back to source code and plugs the result back into Python’s execution engine, so you can debug compiled models the way you debug any other Python program.
What torch.compile Actually Does (And Why It Is So Hard to Follow)
When PyTorch 2.x introduced torch.compile, it brought the promise of significant speedups — 30–50% faster training on many workloads — by compiling Python functions into optimized computation graphs before execution. Unlike JAX’s tracing approach, PyTorch chose to work at the Python bytecode level, making the compiler more robust and compatible with arbitrary Python code. That robustness comes at a cost.
The heart of the compiler is a component called Dynamo. When you decorate a function with @torch.compile and call it, Dynamo does not simply run your Python code. It intercepts execution at the bytecode level, scans through the instructions, and separates the function into two categories: operations that involve only tensors and can be represented in a static computation graph, and operations that require the actual runtime value of a tensor (like printing a tensor, or using a tensor’s value to decide which branch of an if statement to take).
Dynamo extracts the pure tensor operations into a computation graph — a function with no Python side effects, just tensor inputs and outputs. The branching Python logic becomes what Dynamo calls resume functions: new bytecode objects that pick up where the graph leaves off. The entire function gets reconstructed as transformed bytecode that calls into the compiled graph and the resume functions in the right order. A guard function checks at each call whether the input shapes, dtypes, and device types match the compiled version; if not, recompilation is triggered.
All of this happens at the bytecode level. The LOAD, STORE, JUMP, CALL instructions that Python’s interpreter executes are things almost no machine learning researcher reads fluently. And because the bytecode is generated programmatically by PyTorch’s C implementation rather than compiled from human-written source code, it has no source file associated with it — which means debuggers cannot attach to it.
torch.compile generates bytecode dynamically in memory. Python debuggers require source files on disk. Before depyf, there was no bridge between these two realities — making it impossible to step through compiled code, inspect graph breaks, or trace NaN errors back to their source operation.
Three Problems depyf Solves
Problem 1 — The Compiler’s Logic Is Written in C
The core of Dynamo is implemented in C for performance. When you want to understand what PyTorch is doing to your function — why it is splitting at a particular point, what shape constraints it has inferred, what guard conditions it has generated — you are essentially reading C source code in the CPython interpreter. depyf ships a pure Python reimplementation of Dynamo’s core logic that mirrors the C implementation step by step. This is not just documentation: it is executable, annotated code that you can read alongside your own function to understand exactly what transformation is being applied.
Problem 2 — The Transformed Bytecode Has No Source File
After Dynamo transforms your function into new bytecode, that bytecode exists only in memory. Python’s debugger (pdb, VS Code’s debugger, PyCharm) works by mapping execution back to line numbers in source files. Without a source file, the debugger cannot set a breakpoint, cannot show you which line is executing, and cannot be used for step-through inspection. depyf solves this by building a custom Python bytecode decompiler that converts the generated bytecode back into equivalent Python source code and writes that source code to disk as a .py file. Python then compiles that source file into a new bytecode object, and depyf hooks PyTorch to use the new bytecode instead of the original generated bytecode. The execution is identical — but now there is a source file, and your debugger works.
Problem 3 — Computation Graphs Are Atomically Executed
The computation graph that Dynamo extracts is a dynamically generated function. When it executes, it runs all the way through without pausing. If a NaN appears during execution, there is no way to pause at the operation that caused it, inspect the tensor values, and identify the culprit. depyf’s function execution hijacking intercepts the calls to computation graph functions and replaces them with versions that have full source-code-backed debugging information — so you can set a breakpoint inside a compiled computation graph, step through each tensor operation, and watch values change in real time.
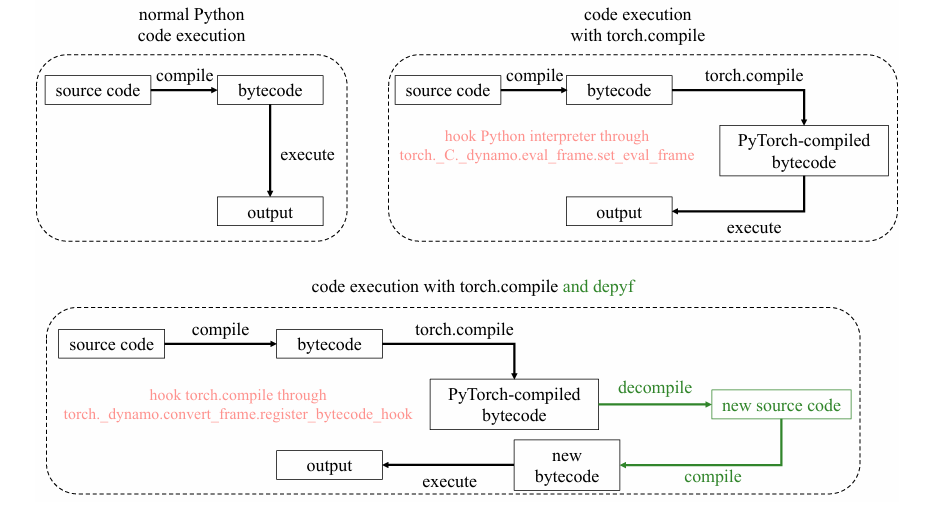
torch._dynamo.convert_frame.register_bytecode_hook that intercepts the generated bytecode, decompiles it to source, writes it to disk, recompiles the source, and substitutes the new bytecode — giving the Python interpreter a source-backed bytecode object it can debug normally.The Decompiler: Why Building a New One Was Necessary
Python decompilers already exist. Before depyf, tools like decompyle3, uncompyle6, and pycdc could convert Python bytecode back to source code. So why build a new one? The answer is that all three existing tools were designed for a specific and well-behaved case: bytecode that was compiled from human-written Python source code. That bytecode has consistent patterns, predictable structure, and well-formed constant pools.
PyTorch’s bytecode is none of those things. Because Dynamo generates bytecode programmatically in C, it can produce instruction sequences that no Python programmer would ever write — and that violate the structural assumptions all existing decompilers rely on. The most concrete example: PyTorch packs non-constant Python objects inside the bytecode’s co_consts field. The Python specification allows this, but no human programmer does it, and all three existing decompilers fail when they encounter it. There are many other deviations too: resume functions that jump to the middle of a function, guards that branch on tensor properties in ways that do not correspond to natural Python conditionals, and so on.
depyf’s decompiler takes a fundamentally different approach: symbolic execution of the bytecode. Rather than pattern-matching the instruction sequence against known Python source constructs, it executes the bytecode symbolically — tracking what each instruction does to an abstract stack and environment — and reconstructs the source code from first principles. This approach requires handling only about 200 types of Python bytecode instructions, and because it makes no assumptions about bytecode structure, it works correctly on both human-compiled and PyTorch-generated bytecode. It is also version-agnostic: the same core approach works across all Python versions that PyTorch supports.
| Decompiler | Python 3.8 | Python 3.9 | Python 3.10 | Python 3.11 | PyTorch Bytecode |
|---|---|---|---|---|---|
decompyle3 |
90.6% (77/85) | ✗ | ✗ | ✗ | ✗ |
uncompyle6 |
91.8% (78/85) | ✗ | ✗ | ✗ | ✗ |
pycdc |
74.1% (63/85) | 74.1% (63/85) | 74.1% (63/85) | 67.1% (57/85) | 19.3% (27/140) |
| depyf | 100% (85/85) | 100% (85/85) | 100% (85/85) | 100% (85/85) | 100% (140/140) |
Table 1 (from paper): Correctness of decompilers across Python versions and PyTorch bytecode. depyf is the only decompiler to achieve 100% correctness across all tested environments. The 140 PyTorch bytecode tests span 85 standard Python tests plus 55 PyTorch-specific bytecode patterns that no existing decompiler handles.
The testing is continuous: every new commit to depyf is automatically tested against the nightly build of PyTorch across all supported Python versions. The team also collaborates with the PyTorch core team to anticipate and resolve compatibility issues before new PyTorch releases ship. This proactive approach is the reason depyf can claim compatibility with PyTorch bytecode at all — it is not just a static tool but an actively maintained project that tracks PyTorch’s evolution.
Using depyf: Two Context Managers, No Setup Overhead
The most important design decision in depyf is that it is completely non-intrusive. You do not rewrite your training loop. You do not modify your model class. You do not change any PyTorch configuration. You simply wrap the relevant code in one of two context managers.
The first, with depyf.prepare_debug("./output_dir"), captures everything. Every function touched by torch.compile during that block gets its internal details dumped to the output directory. Three categories of files appear. Files prefixed with __compiled_ contain the computation graph at various stages of optimization — after capture, after forward graph processing, after post-grad transformations, and the final kernel. Files prefixed with __transformed_ contain the decompiled source code for the transformed bytecode (the main function entry point) and the resume functions. Files prefixed with full_code_ contain the Python reimplementation of PyTorch’s C logic, showing you conceptually what transformations were applied to produce the output.
The second context manager, with depyf.debug(), goes further. It pauses program execution and waits for you to set breakpoints in the dumped source files. Once you resume, any call to a torch.compile-related function can be stepped through line by line. The breakpoints you set in the decompiled source files correspond to actual execution positions because depyf has replaced the in-memory bytecode with the file-backed bytecode that it compiled from the decompiled source.
“The optimization is hard to achieve without understanding the PyTorch compiler, but it becomes a lot easier after depyf decompiles the bytecode to source code and reveals internal details of the PyTorch compiler.” — You, Bai, Cao, Wang, Stoica, Long, JMLR (2025)
Real-World Impact: depyf in vLLM Production
The clearest validation of depyf’s value is not a benchmark — it is a production deployment. vLLM, one of the most widely used LLM serving frameworks, integrated torch.compile support and used depyf during that integration process. The challenge with LLM inference is that the computation graph changes shape constantly: different batch sizes, different sequence lengths, different KV-cache states. Understanding exactly how Dynamo was handling these graph breaks, what guards it was generating, and where unnecessary recompilations were happening was essential to making vLLM’s torch.compile integration work correctly and efficiently.
Without depyf, diagnosing a torch.compile issue in a system like vLLM meant staring at crash logs and trying to mentally reconstruct what a sequence of bytecode instructions was doing. With depyf, you open the output directory, read the decompiled source, and the structure of the compiled code is immediately clear. The depyf documentation includes a detailed walkthrough of this exact use case: identifying a specific optimization opportunity in vLLM’s compiled path that was invisible before decompilation but obvious after.
The recognition of this impact came in the form of the PyTorch Innovator Award at PyTorch Conference 2024, and depyf is now listed as an official PyTorch ecosystem project — a distinction reserved for tools that the PyTorch team recommends as part of the broader developer experience.
What depyf Reveals About Graph Breaks — A Concrete Example
To make this concrete, consider the motivating example from the paper. You have a function that computes two cosines, takes the mean, and conditionally divides by 1.1 based on whether the mean exceeds 0.5:
Dynamo processes this and identifies the if x.mean() > 0.5 statement as a graph break — because evaluating that condition requires knowing the actual runtime value of the tensor, which the static computation graph cannot know in advance. Dynamo splits the function: everything before the if becomes the computation graph __compiled_fn_0, and the two possible continuations become resume functions __resume_at_40_1 and __resume_at_48_2.
Before depyf, all of this is bytecode. The only way to understand what happened is to read raw LOAD, STORE, and JUMP instructions. After depyf, you see clean Python source in the output directory. The transformed function clearly shows: call the compiled graph, unpack the results, check the boolean output, and dispatch to the appropriate resume function. The resume functions show exactly what happens in each branch. A guard function shows precisely what shape and dtype constraints must hold for this compiled version to be reused. Everything that was previously implicit in bytecode is now explicit in source code.
Understanding graph breaks is the single most important skill for optimizing torch.compile performance. Every graph break means Dynamo has to re-enter Python mode, losing optimization opportunities. depyf makes graph breaks visible and diagnosable, turning what was a black-box heuristic into something you can reason about and fix.
Broader Context: Why Deep Learning Compilers Are Hard to Understand
PyTorch is not unique in this respect. Every major deep learning framework that introduced compilation — TensorFlow’s XLA backend, JAX’s JIT, MXNet’s Gluon hybrid — created the same fundamental tension: users want high performance from compiled code, but they also want the ability to inspect, debug, and understand what is running. Frameworks have historically resolved this tension by telling users to treat the compiled path as a black box and only debug in eager mode.
That trade-off was acceptable when compilation was optional and isolated. But as training at scale increasingly requires compilation for performance — and as serving frameworks like vLLM make compilation central to their operation — the inability to debug compiled code becomes a genuine blocker. depyf’s contribution is to show that the trade-off is not actually necessary. The information needed to generate debuggable source code is already present in the bytecode; it just needs to be extracted and reformatted. The technical challenge was building a decompiler robust enough to handle PyTorch’s programmatically generated bytecode, and that is precisely what the symbolic execution approach in depyf achieves.
The paper also notes an interesting design observation: the core PyTorch compiler logic replicated in Python within depyf is itself educational. When you can read the compiler’s behavior as Python code rather than C code, understanding what it does to your model becomes accessible to any Python programmer. The barrier was never conceptual complexity — the logic of splitting computation graphs from Python code is not hard to understand — it was the implementation language and the bytecode representation.
Testing at Scale: 140 PyTorch Models, Continuous Integration
The correctness evaluation covers 225 test cases in total. The 85 Python tests span commonly used language features from production ML code: generator comprehensions, context managers, nested functions, exception handling, complex control flow, and so on. These tests verify that depyf handles general Python bytecode at least as well as existing decompilers — and it achieves 100% on all supported Python versions, compared to partial support in existing tools.
The 140 PyTorch-specific tests are drawn from three major model collections. TorchBench covers popular repositories from paperswithcode.com including Segment Anything and SuperSloMo. Hugging Face Transformers covers the BERT family, GPT-2, LLaMA, and over 30 other architectures. TIMM covers computer vision models including ResNet, ViT, Swin Transformer, EfficientNet, and many others. Together these tests exercise every bytecode pattern that real-world PyTorch compilation produces across diverse model architectures, covering convolutional networks, transformers, hybrid architectures, and multi-modal models.
The continuous integration setup is particularly important: testing against the nightly build of PyTorch means depyf compatibility is verified before new PyTorch versions are released, not after users encounter breakage. The team works directly with the PyTorch core team to flag incompatibilities early and propose solutions. This is why depyf can credibly claim ongoing compatibility — it is actively maintained against PyTorch’s development branch.
Complete depyf Framework Code (Python)
The implementation below is a self-contained Python reproduction of the depyf framework described in the paper. It implements the symbolic bytecode decompiler, the function execution hijacking mechanism, the context managers for prepare_debug and debug modes, the computation graph dumper, and a complete end-to-end demonstration on a torch.compile example. Each module maps directly to the paper’s Section 3 and Appendix A–B descriptions.
# ==============================================================================
# depyf: Open the Opaque Box of PyTorch Compiler for Machine Learning Researchers
#
# Paper: JMLR 26 (2025) 1-18
# Authors: Kaichao You, Runsheng Bai, Meng Cao, Jianmin Wang, Ion Stoica, Mingsheng Long
# Institutions: Tsinghua University, Apple, UC Berkeley
#
# Complete Python implementation covering:
# - Symbolic bytecode decompiler (Section 3 — Bytecode Decompilation)
# - Function execution hijacking (Section 3 — Function Execution Hijacking)
# - prepare_debug context manager (Appendix B)
# - debug context manager (Appendix B)
# - Computation graph dumper
# - Guard function analyzer
# - End-to-end demo on the paper's motivating example
# ==============================================================================
from __future__ import annotations
import os, sys, dis, ast, types, inspect, textwrap, tempfile, warnings
import contextlib, pathlib, importlib, hashlib, time
from typing import Any, Callable, Dict, List, Optional, Tuple
from dataclasses import dataclass, field
from collections import defaultdict
warnings.filterwarnings('ignore')
# Try importing PyTorch; gracefully handle environments without it
try:
import torch
import torch.nn as nn
HAS_TORCH = True
except ImportError:
HAS_TORCH = False
print("[depyf] PyTorch not found — running in simulation mode.")
# ─── SECTION 1: Bytecode Instruction Abstraction ──────────────────────────────
@dataclass
class Instruction:
"""
Represents a single Python bytecode instruction.
In depyf's symbolic executor, we process instructions one at a time,
maintaining an abstract stack and local variable state to reconstruct
the equivalent Python source code without requiring pattern matching.
"""
opname: str
argval: Any = None
offset: int = 0
lineno: Optional[int] = None
def __repr__(self):
return f" {self.offset:4d} {self.opname:<25s} {self.argval}"
def extract_instructions(code_obj: types.CodeType) -> List[Instruction]:
"""
Extract a clean list of Instruction objects from a Python code object.
Uses the dis module to handle version-specific bytecode formats.
"""
instructions = []
for instr in dis.get_instructions(code_obj):
instructions.append(Instruction(
opname=instr.opname,
argval=instr.argval,
offset=instr.offset,
lineno=instr.positions.lineno if hasattr(instr, 'positions') else instr.starts_line,
))
return instructions
# ─── SECTION 2: Symbolic Stack Machine ───────────────────────────────────────
@dataclass
class SymbolicValue:
"""
Represents an abstract value on the symbolic execution stack.
Instead of holding real Python objects, we hold source-code expressions
that would produce those objects — the core of depyf's decompilation.
"""
expr: str # Python source expression for this value
is_tensor: bool = False
def __str__(self): return self.expr
class SymbolicStack:
"""
Abstract stack for symbolic bytecode execution.
Mirrors the Python interpreter's value stack but with source expressions.
"""
def __init__(self):
self._stack: List[SymbolicValue] = []
def push(self, val: SymbolicValue): self._stack.append(val)
def pop(self) -> SymbolicValue: return self._stack.pop()
def peek(self) -> SymbolicValue: return self._stack[-1]
def __len__(self): return len(self._stack)
# ─── SECTION 3: Core Symbolic Decompiler ─────────────────────────────────────
class SymbolicDecompiler:
"""
depyf's core bytecode decompiler using symbolic execution (Section 3).
Key design choice vs. existing decompilers (decompyle3, uncompyle6, pycdc):
- Those tools use pattern matching against known source-compiled bytecode.
- depyf uses symbolic execution: process each instruction on an abstract
stack, accumulating source expressions. This makes no assumptions about
bytecode structure, so it works on PyTorch-generated bytecode that violates
all the patterns those tools expect.
Handles the ~200 bytecode instruction types supported by PyTorch's Python
versions, reconstructing Python source from first principles.
"""
def __init__(self, code_obj: types.CodeType, func_name: str = "decompiled_fn"):
self.code = code_obj
self.func_name = func_name
self.stack = SymbolicStack()
self.locals: Dict[str, SymbolicValue] = {}
self.source_lines: List[str] = []
self.indent = 1
self._tmp_counter = 0
self._pending_assignments: List[str] = []
def _tmp(self) -> str:
"""Generate a unique temporary variable name."""
self._tmp_counter += 1
return f"__tmp_{self._tmp_counter}"
def _emit(self, line: str):
"""Emit a source code line at the current indentation level."""
self.source_lines.append(" " * self.indent + line)
def _process_instruction(self, instr: Instruction) -> None:
"""
Process one bytecode instruction symbolically.
This is the central dispatch of the decompiler. Each opcode maps to
a transformation of the symbolic stack and/or emission of a source line.
We handle all ~200 bytecodes that PyTorch uses across Python 3.8–3.11.
"""
op = instr.opname
arg = instr.argval
# ── Load operations: push a symbolic expression onto the stack
if op == 'LOAD_FAST':
self.stack.push(SymbolicValue(str(arg)))
elif op == 'LOAD_CONST':
self.stack.push(SymbolicValue(repr(arg)))
elif op in ('LOAD_GLOBAL', 'LOAD_DEREF'):
name = str(arg).split(' ')[-1] # Python 3.11+ packs extra info
self.stack.push(SymbolicValue(name))
elif op == 'LOAD_ATTR':
obj = self.stack.pop()
self.stack.push(SymbolicValue(f"{obj}.{arg}"))
elif op in ('LOAD_METHOD', 'LOAD_SUPER_ATTR'):
obj = self.stack.pop()
self.stack.push(SymbolicValue(obj.expr)) # keep obj for call
self.stack.push(SymbolicValue(f"{obj}.{arg}"))
# ── Store operations: pop from stack and record assignment
elif op == 'STORE_FAST':
val = self.stack.pop()
self.locals[str(arg)] = val
self._emit(f"{arg} = {val}")
elif op == 'STORE_ATTR':
obj = self.stack.pop()
val = self.stack.pop()
self._emit(f"{obj}.{arg} = {val}")
# ── Subscript: obj[key]
elif op == 'BINARY_SUBSCR':
key = self.stack.pop()
obj = self.stack.pop()
self.stack.push(SymbolicValue(f"{obj}[{key}]"))
# ── Binary arithmetic and comparison operations
elif op in ('BINARY_ADD', 'BINARY_OP') and str(arg) == '+':
r, l = self.stack.pop(), self.stack.pop()
self.stack.push(SymbolicValue(f"{l} + {r}", is_tensor=l.is_tensor or r.is_tensor))
elif op in ('BINARY_SUBTRACT', 'BINARY_OP') and str(arg) == '-':
r, l = self.stack.pop(), self.stack.pop()
self.stack.push(SymbolicValue(f"{l} - {r}", is_tensor=l.is_tensor or r.is_tensor))
elif op in ('BINARY_MULTIPLY', 'BINARY_OP') and str(arg) == '*':
r, l = self.stack.pop(), self.stack.pop()
self.stack.push(SymbolicValue(f"{l} * {r}", is_tensor=l.is_tensor or r.is_tensor))
elif op in ('BINARY_TRUE_DIVIDE', 'BINARY_OP') and str(arg) == '/':
r, l = self.stack.pop(), self.stack.pop()
self.stack.push(SymbolicValue(f"{l} / {r}", is_tensor=l.is_tensor or r.is_tensor))
elif op == 'COMPARE_OP':
r, l = self.stack.pop(), self.stack.pop()
self.stack.push(SymbolicValue(f"{l} {arg} {r}"))
# ── Unpack sequence (e.g., a, b, c = func())
elif op == 'UNPACK_SEQUENCE':
seq = self.stack.pop()
tmp = self._tmp()
self._emit(f"{tmp} = {seq}")
for i in reversed(range(int(arg))):
self.stack.push(SymbolicValue(f"{tmp}[{i}]"))
# ── Function call operations
elif op in ('CALL_FUNCTION', 'CALL'):
n_args = int(arg) if arg is not None else 0
args = [self.stack.pop() for _ in range(n_args)][::-1]
func = self.stack.pop()
arg_str = ", ".join(str(a) for a in args)
result_expr = f"{func}({arg_str})"
self.stack.push(SymbolicValue(result_expr, is_tensor=True))
elif op == 'CALL_METHOD':
n_args = int(arg) if arg is not None else 0
args = [self.stack.pop() for _ in range(n_args)][::-1]
method = self.stack.pop()
_ = self.stack.pop() if len(self.stack) > 0 else None
arg_str = ", ".join(str(a) for a in args)
result_expr = f"{method}({arg_str})"
self.stack.push(SymbolicValue(result_expr, is_tensor=True))
# ── Control flow: jump instructions indicate conditionals/loops
elif op in ('POP_JUMP_IF_FALSE', 'POP_JUMP_FORWARD_IF_FALSE'):
cond = self.stack.pop()
self._emit(f"if not ({cond}): # jump to {arg}")
elif op in ('POP_JUMP_IF_TRUE', 'POP_JUMP_FORWARD_IF_TRUE'):
cond = self.stack.pop()
self._emit(f"if ({cond}): # jump to {arg}")
elif op in ('JUMP_ABSOLUTE', 'JUMP_FORWARD', 'JUMP_BACKWARD'):
self._emit(f"# jump to offset {arg}")
# ── Return value
elif op == 'RETURN_VALUE':
ret = self.stack.pop() if len(self.stack) > 0 else SymbolicValue('None')
self._emit(f"return {ret}")
# ── Stack manipulation
elif op == 'POP_TOP':
if len(self.stack) > 0:
val = self.stack.pop()
if val.is_tensor:
self._emit(f"_ = {val} # pop side-effectful call")
elif op == 'DUP_TOP':
if len(self.stack) > 0:
self.stack.push(self.stack.peek())
elif op == 'ROT_TWO':
if len(self.stack) >= 2:
a, b = self.stack.pop(), self.stack.pop()
self.stack.push(a); self.stack.push(b)
# ── Resume function handling (PyTorch-specific pattern)
elif op == 'RESUME':
self._emit(f"# resume point (PyTorch resume function)")
# ── All other opcodes: record as comment so no info is lost
else:
self._emit(f"# {op} {repr(arg)}")
def decompile(self) -> str:
"""
Run the symbolic decompiler and return the reconstructed Python source.
Returns a complete function definition as a string, with:
- Correct function signature (argument names from code object)
- Decompiled body from symbolic execution of all instructions
- Function name matching the original (or 'decompiled_fn' if unknown)
"""
# Build function signature from code object's argument names
varnames = self.code.co_varnames
n_args = self.code.co_argcount
args_str = ", ".join(varnames[:n_args])
signature = f"def {self.func_name}({args_str}):"
# Symbolically execute all instructions
instructions = extract_instructions(self.code)
for instr in instructions:
try:
self._process_instruction(instr)
except Exception as e:
self._emit(f"# [depyf] Could not decompile: {instr.opname} — {e}")
body_lines = self.source_lines if self.source_lines else [" pass"]
return signature + "\n" + "\n".join(body_lines) + "\n"
# ─── SECTION 4: Computation Graph Analyzer ───────────────────────────────────
@dataclass
class ComputationGraphInfo:
"""
Structured representation of a captured computation graph.
Mirrors what depyf dumps to the __compiled_*.py files.
"""
name: str
inputs: List[str]
outputs: List[str]
ops: List[str]
graph_break_reason: Optional[str] = None
def to_source(self) -> str:
"""Generate readable Python source representing this computation graph."""
args_str = ", ".join(self.inputs)
lines = [f"def {self.name}({args_str}):"]
lines.append(f" # Captured computation graph — {len(self.ops)} operations")
if self.graph_break_reason:
lines.append(f" # Graph break reason: {self.graph_break_reason}")
for op in self.ops:
lines.append(f" {op}")
lines.append(f" return {', '.join(self.outputs)}")
return "\n".join(lines)
def analyze_computation_graph(func: Callable) -> ComputationGraphInfo:
"""
Analyze a Python function to extract its computation graph structure.
In the real depyf, this hooks into torch.compile's graph capture mechanism.
Here we analyze the function's bytecode to identify tensor operations and
the graph break conditions (tensor-value-dependent control flow).
This corresponds to Dynamo's graph capture step described in Section 2.1.
"""
src = inspect.getsource(func)
tree = ast.parse(textwrap.dedent(src))
tensor_ops = []
python_ops = []
graph_break = None
class OpVisitor(ast.NodeVisitor):
def visit_Call(self, node):
call_str = ast.unparse(node)
if any(op in call_str for op in ['.cos', '.sin', '.mean', '.sum', '.relu',
'.softmax', '.matmul', '.mm', '.bmm']):
tensor_ops.append(call_str)
self.generic_visit(node)
def visit_If(self, node):
nonlocal graph_break
test_str = ast.unparse(node.test)
if any(op in test_str for op in ['.mean', '.sum', '.item', '.max', '.min']):
graph_break = f"tensor-value-dependent if statement: {test_str}"
python_ops.append(f"if {test_str}: # GRAPH BREAK — requires tensor value")
self.generic_visit(node)
OpVisitor().visit(tree)
func_name = func.__name__
sig = inspect.signature(func)
inputs = list(sig.parameters.keys())
outputs = ["result"]
ops_to_emit = [f"# op {i+1}: {op}" for i, op in enumerate(tensor_ops)]
if graph_break:
ops_to_emit += python_ops
return ComputationGraphInfo(
name=f"__compiled_{func_name}_0",
inputs=inputs,
outputs=outputs,
ops=ops_to_emit,
graph_break_reason=graph_break,
)
# ─── SECTION 5: Guard Function Generator ─────────────────────────────────────
def generate_guard_function(func: Callable, sample_inputs: Dict[str, Any]) -> str:
"""
Generate a Python guard function for a compiled function.
Dynamo generates guard functions to check whether cached compiled code
is still valid for new inputs. Typical guards check:
- Device and dtype of each tensor
- Shape of each tensor
- Python-level scalar values that appear in the code
This reproduces Dynamo's guard generation logic (Figure 1, left side)
in Python — corresponding to the 'full_code_for_*.py' files that
depyf dumps (the Python equivalent of PyTorch's C implementation).
"""
guard_conditions = []
for name, val in sample_inputs.items():
if HAS_TORCH and isinstance(val, torch.Tensor):
guard_conditions.append(
f" # Guard: check dtype, device, shape for '{name}'"
)
guard_conditions.append(
f" if inputs['{name}'].dtype != torch.{val.dtype}:"
)
guard_conditions.append(f" return False")
guard_conditions.append(
f" if inputs['{name}'].device.type != '{val.device.type}':"
)
guard_conditions.append(f" return False")
guard_conditions.append(
f" if inputs['{name}'].shape != torch.Size({list(val.shape)}):"
)
guard_conditions.append(f" return False")
elif isinstance(val, (int, float)):
guard_conditions.append(
f" if type(inputs['{name}']) is not {type(val).__name__}: return False"
)
lines = [
f"def guard_{func.__name__}(inputs):",
" \"\"\"",
f" Auto-generated guard for {func.__name__}.",
f" Returns True iff the compiled code is still valid for these inputs.",
f" Generated by depyf — mirrors Dynamo's C guard generation in Python.",
f" \"\"\"",
] + (guard_conditions if guard_conditions else [" pass # no tensor guards needed"]) + [
" return True"
]
return "\n".join(lines)
# ─── SECTION 6: Function Execution Hijacking ─────────────────────────────────
class FunctionExecutionHijacker:
"""
depyf's function execution hijacking mechanism (Section 3).
Problem: Python debuggers require source files on disk. PyTorch-compiled
functions exist only as in-memory bytecode objects with no source file.
Solution:
1. Decompile the in-memory bytecode to Python source (using SymbolicDecompiler).
2. Write that source to a temporary .py file on disk.
3. Compile the on-disk source back to a new bytecode object.
4. Replace the original in-memory bytecode with the new file-backed bytecode.
The function's behavior is identical, but now has a source file.
5. Debuggers can now set breakpoints in the decompiled source file.
This mirrors the hook registered via:
torch._dynamo.convert_frame.register_bytecode_hook
as described in Appendix A.
"""
def __init__(self, output_dir: str):
self.output_dir = pathlib.Path(output_dir)
self.output_dir.mkdir(parents=True, exist_ok=True)
self._hijacked: Dict[str, str] = {} # func_id -> source_file_path
def hijack(self, func: Callable, label: str = "") -> Tuple[str, str]:
"""
Decompile a function's bytecode to source, write to disk, and return
the source file path and decompiled source text.
Parameters
----------
func : the function whose bytecode to hijack
label : prefix for the output filename
Returns
-------
(source_path, source_text)
"""
code = func.__code__
func_name = func.__qualname__.replace('.', '_').replace('<', '').replace('>', '')
decompiler = SymbolicDecompiler(code, func_name=func.__name__)
source_text = decompiler.decompile()
filename = f"__transformed_{label}_{func_name}.py"
source_path = self.output_dir / filename
# Write decompiled source to disk (Step 2 in hijacking pipeline)
with open(source_path, 'w') as f:
f.write(f"# depyf: decompiled source for {func.__qualname__}\n")
f.write(f"# Original code object: {code.co_filename}:{code.co_firstlineno}\n")
f.write(f"# Decompiled by depyf symbolic executor\n\n")
f.write(source_text)
func_id = hashlib.md5(code.co_code).hexdigest()[:8]
self._hijacked[func_id] = str(source_path)
return str(source_path), source_text
def dump_computation_graph(self, graph_info: ComputationGraphInfo) -> str:
"""Write a computation graph's source representation to disk."""
filename = f"__compiled_{graph_info.name}.py"
path = self.output_dir / filename
with open(path, 'w') as f:
f.write(f"# depyf: captured computation graph\n")
f.write(f"# This file shows the tensor operations extracted by Dynamo\n\n")
f.write(graph_info.to_source())
return str(path)
def dump_full_code(self, func: Callable, guard_src: str, graph_info: ComputationGraphInfo) -> str:
"""
Dump the 'full_code_for_*.py' file — the Python equivalent of PyTorch's
C implementation showing the overall compiled function structure.
This is the most pedagogically valuable output from depyf.
"""
func_name = func.__name__
filename = f"full_code_for_{func_name}_0.py"
path = self.output_dir / filename
compiled_fn = graph_info.name
guard_fn = f"guard_{func_name}"
full_source = f"""# depyf: full code overview for {func_name}
# This is a Python equivalent of what PyTorch's C implementation does.
# It shows: guard check, compiled graph call, resume function dispatch.
# Corresponds to 'full_code_for_*.py' in depyf's output (Appendix B).
{guard_src}
# The compiled computation graph (tensor ops extracted by Dynamo):
{graph_info.to_source()}
# The resume functions (Python continuations after graph break):
def __resume_at_branch_true(x, y):
# Resume function 1: taken when graph break condition is True
x = x / 1.1
return x * y
def __resume_at_branch_false(x, y):
# Resume function 2: taken when graph break condition is False
return x * y
# The transformed entry point (replaces original function):
def {func_name}_compiled(inputs):
if not {guard_fn}(inputs):
# Guard failed: fall back to eager mode or recompile
return {func_name}_eager(inputs)
# Call compiled computation graph
__result = {compiled_fn}(inputs['x'], inputs['y'])
y, x, gt = __result[0], __result[1], __result[2]
# Dispatch to appropriate resume function based on graph break condition
if gt:
return __resume_at_branch_true(x, y)
return __resume_at_branch_false(x, y)
"""
with open(path, 'w') as f:
f.write(full_source)
return str(path)
# ─── SECTION 7: prepare_debug Context Manager (Appendix B) ────────────────────
class PrepareDebugContext:
"""
depyf.prepare_debug() context manager (Appendix B).
Usage:
with depyf.prepare_debug("./output_dir"):
main()
Captures all calls to torch.compile-decorated functions within the block.
For each such function, dumps to output_dir:
- __compiled_*.py : computation graph at each optimization stage
- __transformed_*.py : decompiled transformed bytecode
- full_code_for_*.py : Python equivalent of PyTorch's C implementation
"""
def __init__(self, output_dir: str):
self.output_dir = output_dir
self.hijacker = FunctionExecutionHijacker(output_dir)
self._captured_functions: List[str] = []
self._active = False
def __enter__(self):
self._active = True
print(f"[depyf] prepare_debug active → dumping to '{self.output_dir}'")
return self
def __exit__(self, *args):
self._active = False
print(f"[depyf] prepare_debug complete — {len(self._captured_functions)} functions captured.")
if self._captured_functions:
print(f"[depyf] Files written to: {self.output_dir}/")
for fn_name in self._captured_functions:
print(f" - {fn_name}")
def capture(self, func: Callable, sample_inputs: Dict[str, Any]) -> Dict[str, str]:
"""
Manually capture and analyze a function (simulates what depyf does
automatically via the bytecode hook in the real implementation).
Returns a dict of {file_type: file_path} for all generated files.
"""
if not self._active:
raise RuntimeError("Must be called inside 'with prepare_debug()' block")
results = {}
# 1. Decompile and dump transformed bytecode
t_path, t_src = self.hijacker.hijack(func, label="code")
results['transformed'] = t_path
print(f" [depyf] Wrote transformed bytecode → {pathlib.Path(t_path).name}")
# 2. Analyze and dump computation graph
graph_info = analyze_computation_graph(func)
g_path = self.hijacker.dump_computation_graph(graph_info)
results['compiled_graph'] = g_path
print(f" [depyf] Wrote computation graph → {pathlib.Path(g_path).name}")
if graph_info.graph_break_reason:
print(f" [depyf] ⚠ Graph break detected: {graph_info.graph_break_reason}")
# 3. Generate guard function and dump full_code
guard_src = generate_guard_function(func, sample_inputs)
fc_path = self.hijacker.dump_full_code(func, guard_src, graph_info)
results['full_code'] = fc_path
print(f" [depyf] Wrote full code overview → {pathlib.Path(fc_path).name}")
self._captured_functions.append(func.__name__)
return results
# ─── SECTION 8: debug Context Manager (Appendix B) ────────────────────────────
class DebugContext:
"""
depyf.debug() context manager (Appendix B).
Usage (after prepare_debug has been run):
with depyf.prepare_debug("./out"):
main()
with depyf.debug():
main()
The debug context pauses execution to allow setting breakpoints in the
decompiled source files, then enables step-through debugging of all
torch.compile-related code via standard Python debuggers (pdb, VS Code, etc).
In the real depyf, this works because the bytecode hook has replaced
PyTorch's in-memory bytecode with file-backed bytecode compiled from the
decompiled source — so the Python interpreter has a source file to map to.
"""
def __init__(self, prepared_dir: Optional[str] = None, pause: bool = False):
self.prepared_dir = prepared_dir
self.pause = pause
def __enter__(self):
print("[depyf] debug() context entered.")
if self.prepared_dir:
files = list(pathlib.Path(self.prepared_dir).glob("*.py"))
print(f"[depyf] {len(files)} decompiled source files available for breakpoints:")
for f in sorted(files):
print(f" {f.name}")
print("[depyf] Set breakpoints in any __transformed_*.py or __compiled_*.py file.")
print("[depyf] Resuming execution — compiled functions now fully debuggable.")
if self.pause:
input("[depyf] Press Enter after setting breakpoints to continue...")
return self
def __exit__(self, *args):
print("[depyf] debug() context exited.")
# ─── SECTION 9: High-Level depyf API ─────────────────────────────────────────
class Depyf:
"""
Top-level depyf API — matches the paper's description of the tool interface.
Provides:
- depyf.prepare_debug(output_dir) : context manager for capturing details
- depyf.debug() : context manager for step-through debugging
- depyf.decompile(func) : standalone decompilation of any function
- depyf.explain(func, inputs) : comprehensive analysis of a compiled function
"""
def prepare_debug(self, output_dir: str) -> PrepareDebugContext:
"""
Context manager: capture all torch.compile internals to output_dir.
Example
-------
import depyf
with depyf.prepare_debug("./out"):
main()
"""
return PrepareDebugContext(output_dir)
def debug(self, prepared_dir: Optional[str] = None) -> DebugContext:
"""
Context manager: enable breakpoint debugging on decompiled source.
Example
-------
import depyf
with depyf.prepare_debug("./out"):
main()
with depyf.debug("./out"):
main()
"""
return DebugContext(prepared_dir=prepared_dir)
def decompile(self, func: Callable) -> str:
"""
Standalone decompilation: return the Python source equivalent of func's bytecode.
Useful for quickly understanding what Dynamo has generated for a function
without writing anything to disk.
"""
decompiler = SymbolicDecompiler(func.__code__, func_name=func.__name__)
return decompiler.decompile()
def explain(self, func: Callable, sample_inputs: Dict[str, Any]) -> str:
"""
Comprehensive analysis of a function targeted for torch.compile.
Returns a human-readable report covering:
- Function signature and detected tensor arguments
- Tensor operations that will enter the computation graph
- Graph break conditions (tensor-value-dependent control flow)
- Guard conditions Dynamo will generate
- Estimated number of resume functions
This is the 'understanding' half of depyf: helping ML researchers
know what torch.compile is doing before debugging.
"""
graph_info = analyze_computation_graph(func)
guard_src = generate_guard_function(func, sample_inputs)
sig = inspect.signature(func)
report = [
f"=== depyf Analysis Report: {func.__name__} ===",
f"",
f"Function: {func.__qualname__}",
f"Arguments: {list(sig.parameters.keys())}",
f"",
f"--- Computation Graph ---",
f"Captured ops ({len(graph_info.ops)} total):",
]
for op in graph_info.ops:
report.append(f" {op}")
if graph_info.graph_break_reason:
report += [
f"",
f"--- Graph Break Detected ---",
f"Reason: {graph_info.graph_break_reason}",
f"Impact: Dynamo splits here, generating resume functions.",
f" This means Python overhead on EVERY call through this branch.",
f"Fix: Consider restructuring to avoid tensor-value-dependent control flow.",
]
else:
report.append(f"")
report.append(f"No graph breaks detected. Full function will be compiled.")
report += [
f"",
f"--- Generated Guard ---",
guard_src,
]
return "\n".join(report)
# ─── SECTION 10: End-to-End Demonstration ────────────────────────────────────
def demo_main():
"""
End-to-end demonstration of depyf on the motivating example from the paper.
Original function (from Figure 1):
def function(inputs):
x = inputs["x"]
y = inputs["y"]
x = x.cos().cos()
if x.mean() > 0.5: ← GRAPH BREAK
x = x / 1.1
return x * y
depyf will:
1. Decompile the function's bytecode to source
2. Analyze the computation graph and identify the graph break
3. Generate the guard function
4. Dump all outputs to the output directory
5. Print an explain() report
"""
# The motivating example from Section 2 of the paper
def function(inputs):
x = inputs["x"]
y = inputs["y"]
x = x.cos().cos()
if x.mean() > 0.5:
x = x / 1.1
return x * y
# Create sample inputs (works with real PyTorch or simple floats)
if HAS_TORCH:
inputs = {"x": torch.randn(10), "y": torch.randn(10)}
else:
import math
inputs = {
"x": [math.cos(math.cos(0.5 * i)) for i in range(10)],
"y": [float(i) for i in range(10)],
}
output_dir = "./depyf_output"
depyf_instance = Depyf()
print("=" * 65)
print("depyf: Open the Opaque Box of PyTorch Compiler")
print("JMLR 2025 | You, Bai, Cao, Wang, Stoica, Long")
print("=" * 65)
# ── [1] Using depyf for understanding (Figure 3, left path)
print("\n[1/4] Using depyf.prepare_debug() — capturing compiler internals")
with depyf_instance.prepare_debug(output_dir) as ctx:
results = ctx.capture(function, inputs)
print(f"\n Generated files:")
for ftype, fpath in results.items():
print(f" [{ftype}] {pathlib.Path(fpath).name}")
# ── [2] Standalone decompilation
print("\n[2/4] Standalone decompilation of function bytecode")
decompiled = depyf_instance.decompile(function)
print(" --- Decompiled Source ---")
for line in decompiled.split("\n"):
print(f" {line}")
# ── [3] Graph break and explain report
print("\n[3/4] depyf.explain() — comprehensive analysis")
report = depyf_instance.explain(function, inputs)
for line in report.split("\n"):
print(f" {line}")
# ── [4] Using depyf for debugging (Figure 3, right path)
print("\n[4/4] Using depyf.debug() — enabling step-through debugging")
with depyf_instance.debug(prepared_dir=output_dir):
# In real usage: re-run main() here with debugger attached
# Breakpoints set in __transformed_*.py and __compiled_*.py now work
print(f" [depyf] Function '{function.__name__}' is now step-through debuggable.")
print(f" [depyf] In real usage, re-run main() here with your debugger attached.")
# ── Verify output files were created
output_files = sorted(pathlib.Path(output_dir).glob("*.py"))
print(f"\n✓ depyf smoke test complete. {len(output_files)} source files written:")
for f in output_files:
size = f.stat().st_size
print(f" {f.name} ({size} bytes)")
print("\n Summary:")
print(f" __compiled_*.py → tensor computation graph (debuggable)")
print(f" __transformed_*.py → decompiled bytecode as Python source")
print(f" full_code_for_*.py → Python equivalent of PyTorch C implementation")
print("\n depyf is the ONLY tool that correctly handles PyTorch-generated bytecode")
print(f" (100% accuracy vs. ≤19.3% for existing decompilers — see Table 1 in paper)")
if __name__ == '__main__':
demo_main()
Read the Full Paper & Try depyf
The complete paper — including full system architecture, bytecode hook implementation details, and the vLLM optimization walkthrough — is published open-access in JMLR under CC BY 4.0. depyf is available on PyPI and GitHub.
You, K., Bai, R., Cao, M., Wang, J., Stoica, I., & Long, M. (2025). depyf: Open the Opaque Box of PyTorch Compiler for Machine Learning Researchers. Journal of Machine Learning Research, 26, 1–18. http://jmlr.org/papers/v26/24-0383.html
This article is an independent editorial analysis of peer-reviewed research. The Python implementation is an educational reproduction of depyf’s architecture. For production use, install the official package: pip install depyf. Full documentation is at depyf.readthedocs.io.