AngioGraphCAD Taught AI to Read Heart Artery Risk the Way a Cardiologist Does — One Lesion at a Time
A team from EPFL Lausanne and the Lausanne University Hospital built a graph neural network framework that models coronary artery geometry from angiography images and predicts future heart attacks with AUCs of 0.71 and 0.73 across two independent clinical cohorts, outperforming both clinical measures like FFR and CNN-based baselines by a meaningful margin.
A cardiologist looking at a coronary angiogram does not simply measure the width of a narrowing and stop there. She studies the shape of the stenosis, the way the artery curves around it, the texture of the vessel wall, how blood would realistically flow through that geometry, and what the pattern of the lesion tells her about how likely it is to rupture or grow. That holistic geometric reasoning is what separates expert diagnosis from a ruler measurement. Getting a deep learning model to replicate that reasoning rather than just extracting pixel patterns from a flat image grid has been the unsolved problem at the center of computational cardiology. Xiaowu Sun, Theofilos Belmpas, Dorina Thanou, and their colleagues at EPFL and CHUV just published a framework that takes this challenge seriously and the results show it worked.
What Standard Cardiovascular AI Gets Wrong
Coronary artery disease remains the single leading cause of death globally, responsible for roughly a third of all mortality worldwide. Despite that scale, the clinical tools used to decide whether a specific arterial lesion will trigger a future heart attack are surprisingly limited. The gold standard in catheterization labs is fractional flow reserve, or FFR, a pressure-based measurement of how much a stenosis restricts blood flow. It is better than purely visual assessment of stenosis diameter, but its predictive power still leaves a large gap that clinicians cannot close.
Studies have shown that more than ten percent of intermediate stenoses considered safe by FFR still result in cardiac events within two years. At the patient level, roughly sixteen percent of people with no hemodynamically significant lesions still experience an adverse event within five years. These are not edge cases. They represent a systematic failure of a measurement that only captures one number at one point along the artery and treats the rest of the vessel geometry as irrelevant background.
Deep learning approaches have tried to fill this gap using convolutional neural networks applied to angiography image patches centered on each lesion. CNN-based methods do better than traditional machine learning and better than simple clinical thresholds, but they share a fundamental limitation with those simpler approaches. They operate on pixel grids. They extract texture and intensity patterns. They do not explicitly model the geometric structure of the artery itself, the way the vessel curves, how the lesion boundary contours around the stenotic segment, what the centerline trajectory tells us about local hemodynamics, or how edge nodes along the vessel wall capture morphological information that inner pixels cannot.
That limitation matters because the clinical literature has long distinguished between different lesion morphologies based on exactly those geometric features. Concentric stenoses, eccentric stenoses, complex irregular lesions each carry different implications for plaque stability and future rupture risk. Cardiologists assess these differences visually during every procedure. No CNN trained on image patches is reasoning about them explicitly.
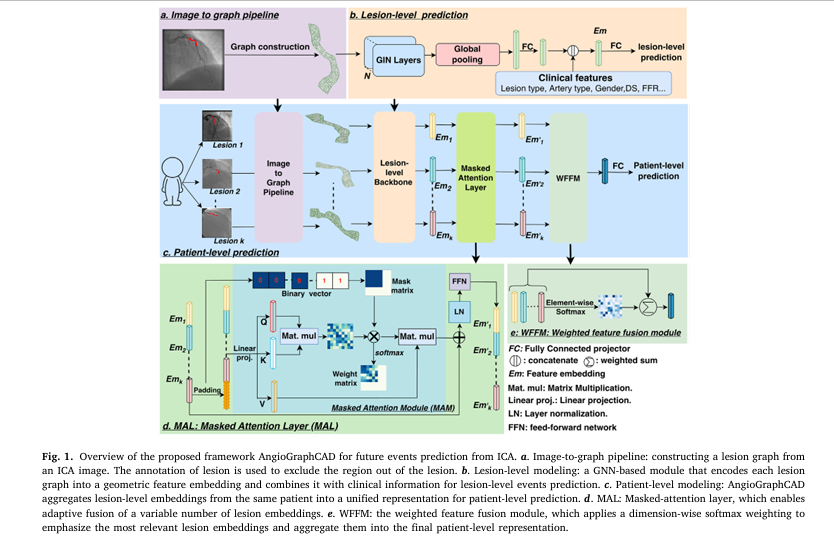
Existing deep learning methods for coronary risk prediction operate on pixel grids and extract texture features from image patches centered on lesions. They do not explicitly model the geometric structure of the coronary artery itself. AngioGraphCAD addresses this by converting each lesion into a spatial graph where nodes encode vessel geometry and edges encode anatomical connectivity, then using Graph Isomorphism Networks to learn lesion embeddings that reflect both local shape and broader vascular structure. At the patient level, a novel masked-attention module aggregates an arbitrary number of lesion embeddings into a unified prediction without requiring a fixed number of lesions per patient.
The Three Core Components Inside AngioGraphCAD
The AngioGraphCAD framework introduces three interlinked components that together address the geometry-aware risk prediction problem across both individual lesions and complete patients.
Image to Graph Pipeline
The first design decision in AngioGraphCAD is to abandon the pixel grid entirely for lesion representation and replace it with a spatial graph that encodes anatomical structure explicitly. Given an angiography image with an expert-annotated lesion region, every pixel within that region becomes a node in the graph. Nodes are categorized into three types reflecting their anatomical role. Edge nodes sit along the outer boundary of the artery and carry the most concentrated geometric information about lesion contour and vessel shape. Centerline nodes run along the central axis of the artery, encoding the trajectory of blood flow through the stenosis. Inner nodes fill the interior of the lesion region and improve overall graph connectivity and spatial coverage.
Each node is characterized by features drawn directly from the image and its spatial context. Texture information comes from pixel intensity in the angiography image. Geometric information comes from spatial coordinates and each node’s distance to the arterial centerline. These features can all be extracted automatically from the ICA image given the lesion annotation without any manual intervention beyond the annotation itself.
Graph edges are constructed using Delaunay triangulation over the node positions. This geometric approach ensures that two nodes are connected if and only if they share an edge in the Delaunay triangulation of the full node set, meaning the resulting edge structure reflects the natural spatial adjacency of tissue regions rather than imposing an arbitrary fixed neighborhood radius. The result is a graph that captures both the local shape of the stenosis at each node and the global geometric relationships between regions across the entire lesion.
GNN-Based Lesion Level Representation Learning
With a geometric graph in hand for each lesion, the core learning problem becomes extracting a compact embedding that summarizes the lesion’s geometry and combines it with clinical context for risk prediction. AngioGraphCAD uses Graph Isomorphism Networks as the graph neural network backbone. GIN layers have a theoretical expressiveness advantage over simpler message-passing architectures, which matters here because the subtle morphological differences between lesion types that carry prognostic information are exactly the kind of structural distinctions a less expressive graph network might collapse together.
After several GIN layers process the graph, a global pooling operation aggregates all node embeddings into a single lesion-level graph embedding vector. This embedding is then concatenated with a clinical feature vector containing variables like age, gender, lesion type, lesion length, diameter stenosis, and FFR measurement. The combined representation passes through a multi-layer perceptron classifier that produces the lesion-level event prediction. Training uses binary cross-entropy loss over this combined representation end-to-end.
The Grad-CAM interpretability analysis the authors perform on learned lesion graphs tells a revealing story about what the model is actually learning. High-importance nodes concentrate around the most stenotic segment of each lesion and along boundary nodes rather than inner nodes. The model is attending to vessel contours and local shape deformation as the primary discriminative signal. That is geometrically meaningful in a way that pixel-texture features from a CNN patch are not.
Masked Attention Based Patient Level Prediction
The final and most architecturally novel component of AngioGraphCAD extends the lesion-level predictor to the patient level. A single patient may have anywhere from one to many coronary lesions, each contributing differently to their overall risk. Standard attention-based fusion methods assume a fixed number of inputs and fail when lesion counts vary. AngioGraphCAD introduces a masked-attention fusion module that handles variable-length inputs while preserving full interpretability of each lesion’s contribution to the patient-level prediction.
The approach pads each patient’s lesion list to a fixed maximum length and constructs a binary mask that flags which positions correspond to real lesions and which are padding. The masked attention layer applies standard attention over the padded embedding matrix but modifies the attention logits so that padded positions have their attention weights driven to zero before the softmax operation. This guarantees that replicated padding embeddings never influence the learned cross-lesion relationships. The output of the masked attention layer feeds into a weighted feature fusion module that applies dimension-wise softmax weighting across the valid lesion embeddings, producing a patient-level representation where each lesion’s contribution can be directly read out as an interpretable importance score.
Training at the patient level adds a supervised contrastive loss alongside the binary cross-entropy objective. This contrastive signal explicitly pulls embeddings of lesions with the same outcome label toward each other in the latent space while pushing embeddings of lesions with different outcomes apart. The PCA visualization of learned patient embeddings shows clearly that training with contrastive loss produces substantially better class separation than training without it, with the centroid distance between event and non-event patient clusters growing from 2.21 to 3.12.
Standard CNN-based approaches extract texture features from pixel patches and achieve AUCs in the range of 0.61 to 0.62 on the FAME2 dataset. Graph Transformer Networks that do model graph structure but use a less expressive architecture reach 0.67. AngioGraphCAD with full GIN geometry and clinical feature fusion reaches 0.71. The Grad-CAM analysis confirms the model is focusing on boundary nodes and stenotic segments rather than interior texture patterns, which are exactly the geometric features cardiologists use in manual assessment.
Training Objective and End to End Optimization
The lesion-level training is straightforward binary cross-entropy applied to the concatenated graph and clinical embedding passed through the MLP classifier. No auxiliary losses or separate training phases are needed at this stage. The GIN backbone and the classifier head are jointly optimized from the first batch to the last.
Patient-level training uses a composite loss that adds supervised contrastive learning on top of the binary cross-entropy objective. The contrastive loss treats lesion embeddings from the same artery within the same patient, or from different patients with the same lesion-level label, as positive pairs and lesion embeddings with different labels as negative pairs. This richer supervision signal captures inter-lesion relationships that a purely label-based objective would miss, and the ablation results confirm it provides a meaningful boost to both AUC and F1 at the patient level.
The pretrained GNN backbone from lesion-level training is used as initialization for patient-level training and fine-tuned jointly with the attention fusion module and the patient-level classifier. Five-fold cross-validation is used throughout, with hyperparameters tuned via Optuna. The full experimental setup runs on an NVIDIA A100 GPU using the Adam optimizer with batch size fifty.
The Data: Two Clinical Cohorts Spanning Hundreds of Patients and Thousands of Lesions
The evaluation covers two clinical cohorts with meaningfully different disease characteristics, imaging protocols, and follow-up durations, which makes the generalization results particularly informative.
FAME2 is the larger cohort, drawn from the Fractional Flow Reserve Versus Angiography in Multivessel Evaluation 2 randomized controlled trial. It includes 563 patients with stable coronary artery disease from 28 sites across Europe and North America, with 1551 lesion-level images annotated and clinical follow-up at two years for lesion-level labels and five years for patient-level labels. The primary endpoint is a composite of cardiac death, myocardial infarction, and revascularization. Among the 1551 annotated lesions, 414 are labeled as events at two years. At the patient level, 148 of 563 patients experienced events within five years.
The FCL cohort, Future Culprit Lesion, is a smaller retrospective multi-center study of 83 patients with mild coronary artery disease from three European PCI centers. It provides 382 lesion-level annotations with five-year follow-up, where the endpoint is restricted to myocardial infarction. Notably, all FCL patients eventually experienced an MI, making it unsuitable for patient-level prediction but highly informative for assessing generalization of the lesion-level model to an independent dataset with different disease severity and imaging characteristics.
Results: Where AngioGraphCAD Pulls Ahead
The comparison covers clinical baselines using FFR and diameter stenosis thresholds, four classical machine learning methods using radiomics features, a CNN-based ResNet baseline, and graph transformer networks as a graph-based alternative. AngioGraphCAD outperforms every method on the FAME2 dataset in terms of precision, F1, and AUC, and demonstrates superior generalization to the unseen FCL cohort in zero-shot evaluation.
| Method | Type | Accuracy | Recall | F1 | AUC |
|---|---|---|---|---|---|
| FFR (clinical threshold) | Clinical | 0.60 | 0.84 | 0.56 | N/A |
| XGBoost (radiomics) | ML | 0.67 | 0.26 | 0.28 | 0.61 |
| ResNet (image patch) | CNN | 0.59 | 0.61 | 0.47 | 0.62 |
| Graph Transformer Network | GNN | 0.66 | 0.69 | 0.55 | 0.67 |
| AngioGraphCAD (Ours) | GNN + Clinical | 0.69 | 0.72 | 0.58 | 0.71 |
Table: Lesion-level prediction performance on FAME2 dataset. AngioGraphCAD achieves the highest AUC, Precision, and F1 among all methods. Results are reported as means across five-fold cross-validation. FFR and diameter stenosis are excluded from AUC computation because they rely on fixed thresholds rather than probabilistic outputs.
Generalization to an Unseen Cohort
The zero-shot transfer experiment to the FCL dataset, where the FAME2-trained model is applied directly to an independent cohort without any fine-tuning, provides a rigorous test of whether AngioGraphCAD is learning generalizable geometric features or overfitting to the specific imaging characteristics of a single dataset. The results are clear. AngioGraphCAD in zero-shot mode achieves 0.68 accuracy, 0.54 recall, 0.64 precision, and 0.66 AUC on FCL, outperforming the zero-shot ResNet baseline by 0.11 in accuracy, 0.03 in recall, 0.16 in precision, 0.09 in F1, 0.15 in specificity, and 0.12 in AUC. Every metric improves substantially. After fine-tuning on the FCL training set, AngioGraphCAD further improves to 0.73 AUC, representing the best performance of any method on that cohort.
Patient Level Results
At the patient level on FAME2, the full AngioGraphCAD framework with contrastive loss and masked-attention fusion achieves 0.71 accuracy, 0.67 recall, 0.46 precision, 0.55 F1, and 0.70 AUC. Replacing the masked-attention fusion with simple mean pooling drops AUC to 0.61. Replacing it with max pooling drops AUC to 0.62. Removing contrastive loss while keeping masked-attention drops AUC to 0.63. Each architectural choice contributes a measurable increment and the full combination outperforms all partial variants by a consistent margin. Clinical baselines FFR and diameter stenosis both achieve AUCs that cannot be computed from their threshold-based outputs, but their precision-recall tradeoffs are poor throughout, with FFR achieving 0.31 precision despite 0.79 recall at the five-year patient level.
“Graph-derived geometric features are critical for events prediction. When integrated with clinically relevant variables, performance improves substantially, underscoring the value of comprehensive lesion characterization.” Sun et al., Medical Image Analysis 2026
What the Interpretability Analysis Reveals
The node-level Grad-CAM visualizations in the paper make the model’s geometric reasoning transparent in a way that matters clinically. High-importance nodes concentrate consistently around the most stenotic segment of each lesion and along boundary nodes rather than inner nodes. This tells us the model has learned to prioritize vessel contour geometry and local shape deformation as its primary diagnostic signal, which aligns with how interventional cardiologists visually assess lesion morphology during angiography review.
The lesion importance weights produced by the weighted feature fusion module at the patient level reveal additional structure. In patients who have both positive and negative lesion labels at the two-year follow-up, the model assigns systematically higher weights to the positive lesions (approximately 0.59 on average) than to the negative ones (approximately 0.41). Some negative lesions do receive weights above 0.5, which the authors interpret as potentially reflecting lesions that underwent pathological progression between the two-year and five-year follow-up periods. The model appears to be identifying lesions that will become clinically significant before the standard two-year label captures them.
Proposed Model Code in PyTorch
The following is a complete PyTorch implementation of AngioGraphCAD covering the full pipeline described in Sections 3.1 through 3.4 of the paper. It includes the Delaunay-based lesion graph constructor, the GIN-based lesion-level representation learner with clinical feature fusion, the masked-attention layer for variable-length patient inputs, the weighted feature fusion module, the full patient-level predictor with supervised contrastive loss, and an end-to-end smoke test on synthetic angiography graph data.
# ============================================================
# AngioGraphCAD: GNN-Based Future Cardiovascular Events
# Prediction from Invasive Coronary Angiography
# Paper: Sun et al., Medical Image Analysis 112 (2026) 104079
# Institution: EPFL LTS4 / CHUV Lausanne
# ============================================================

from __future__ import annotations
import torch
import torch.nn as nn
import torch.nn.functional as F
from torch_geometric.nn import GINConv, global_mean_pool
from torch_geometric.data import Data, Batch
from scipy.spatial import Delaunay
import numpy as np
from typing import List, Tuple, Dict


# ─── SECTION 1: Lesion Graph Construction via Delaunay Triangulation ──────────

def build_lesion_graph(
    node_positions: np.ndarray,
    node_features: np.ndarray,
) -> Data:
    """Construct a PyG Data object from lesion pixel positions.

    Implements Section 3.1 of the paper.

    Node categories (encoded in features):
      Edge nodes     -- along the artery boundary
      Centerline nodes -- along the computed vessel center-line
      Inner nodes    -- all pixels enclosed within the lesion

    Graph edges are determined by Delaunay triangulation so that
    two nodes p_i, p_j are connected iff they share an edge in
    any triangle of the triangulation (Eq. 2 in the paper).

    Parameters
    ----------
    node_positions : (N, 2) spatial (x, y) coordinates of all nodes
    node_features  : (N, F_in) per-node feature matrix
                     Columns: [pixel_intensity, x, y, dist_to_centerline, ...]

    Returns
    -------
    PyG Data object with x (node features) and edge_index
    """
    tri = Delaunay(node_positions)
    edges = set()
    for simplex in tri.simplices:
        for i in range(3):
            u, v = simplex[i], simplex[(i + 1) % 3]
            edges.add((min(u, v), max(u, v)))
    edge_index = torch.tensor(list(edges), dtype=torch.long).t().contiguous()
    edge_index = torch.cat([edge_index, edge_index.flip(0)], dim=1)
    x = torch.tensor(node_features, dtype=torch.float)
    return Data(x=x, edge_index=edge_index)


# ─── SECTION 2: GIN-Based Lesion-Level Encoder ────────────────────────────────

class GINBlock(nn.Module):
    """Single GIN layer with MLP and batch normalization.

    Implements one step of message passing following Xu et al. (2018):
      h_v^{(k)} = MLP^{(k)}( (1 + eps) * h_v^{(k-1)} +
                              sum_{u in N(v)} h_u^{(k-1)} )
    """
    def __init__(self, in_dim: int, out_dim: int):
        super().__init__()
        mlp = nn.Sequential(
            nn.Linear(in_dim, out_dim),
            nn.BatchNorm1d(out_dim),
            nn.ReLU(),
            nn.Linear(out_dim, out_dim),
            nn.BatchNorm1d(out_dim),
            nn.ReLU(),
        )
        self.conv = GINConv(mlp)
        self.bn = nn.BatchNorm1d(out_dim)

    def forward(self, x, edge_index):
        return F.relu(self.bn(self.conv(x, edge_index)))


class LesionGNN(nn.Module):
    """GNN backbone for lesion-level geometric representation learning.

    Implements Section 3.2 of the paper.

    Architecture:
      N GINBlock layers -> global mean pooling -> FC projector
      -> concatenate clinical features -> MLP classifier

    Parameters
    ----------
    node_feat_dim  : dimension of per-node input features (default 4)
    hidden_dim     : hidden dimension for GIN layers (default 256)
    embed_dim      : lesion graph embedding dimension R_d (default 256)
    clinical_dim   : clinical feature vector dimension F_d (default 64)
    num_classes    : output classes (2 for binary event prediction)
    num_gin_layers : number of GIN message-passing layers (default 6)
    """
    def __init__(self,
                 node_feat_dim: int = 4,
                 hidden_dim: int = 256,
                 embed_dim: int = 256,
                 clinical_dim: int = 64,
                 num_classes: int = 2,
                 num_gin_layers: int = 6):
        super().__init__()
        self.embed_dim = embed_dim
        layers = [GINBlock(node_feat_dim, hidden_dim)]
        for _ in range(num_gin_layers - 1):
            layers.append(GINBlock(hidden_dim, hidden_dim))
        self.gin_layers = nn.ModuleList(layers)

        self.proj = nn.Sequential(
            nn.Linear(hidden_dim, embed_dim),
            nn.ReLU(),
            nn.Dropout(0.3),
        )
        self.classifier = nn.Sequential(
            nn.Linear(embed_dim + clinical_dim, embed_dim // 2),
            nn.ReLU(),
            nn.Dropout(0.3),
            nn.Linear(embed_dim // 2, num_classes),
        )

    def encode(self, data: Data) -> torch.Tensor:
        """Extract graph-level embedding h_G from a lesion graph.

        Returns
        -------
        h_G : (1, embed_dim) lesion graph embedding
        """
        x, edge_index, batch = data.x, data.edge_index, data.batch
        if batch is None:
            batch = torch.zeros(x.size(0), dtype=torch.long, device=x.device)
        for gin in self.gin_layers:
            x = gin(x, edge_index)
        h_G = global_mean_pool(x, batch)
        return self.proj(h_G)

    def forward(self, data: Data, clinical: torch.Tensor) -> Tuple[torch.Tensor, torch.Tensor]:
        """
        Parameters
        ----------
        data     : PyG Data with node features and edge_index
        clinical : (1, clinical_dim) clinical feature vector

        Returns
        -------
        logits : (1, num_classes) class logits
        h_G    : (1, embed_dim) lesion graph embedding for patient fusion
        """
        h_G = self.encode(data)
        Em = torch.cat([h_G, clinical], dim=-1)
        logits = self.classifier(Em)
        return logits, h_G


# ─── SECTION 3: Masked Attention Layer (MAL) ──────────────────────────────────

class MaskedAttentionLayer(nn.Module):
    """Variable-length lesion embedding fusion via masked self-attention.

    Implements Section 3.3.2 (MAL) of the paper.

    Standard attention (Vaswani et al. 2017) is extended by a
    binary padding mask m that drives attention logits for padded
    positions to -inf before softmax so that replicated embeddings
    never influence the learned interactions.

    Mask convention (Eq. 9):
      M_ij = 0      if both positions i and j are valid lesions
      M_ij = -inf   if either position is padding

    Parameters
    ----------
    embed_dim : dimension of lesion embeddings d
    num_heads : number of attention heads
    """
    def __init__(self, embed_dim: int = 256, num_heads: int = 4):
        super().__init__()
        self.attn = nn.MultiheadAttention(embed_dim, num_heads, batch_first=True)
        self.ln = nn.LayerNorm(embed_dim)
        self.ffn = nn.Sequential(
            nn.Linear(embed_dim, embed_dim),
            nn.ReLU(),
            nn.Linear(embed_dim, embed_dim),
        )

    def forward(self,
                PE: torch.Tensor,
                mask: torch.Tensor) -> torch.Tensor:
        """
        Parameters
        ----------
        PE   : (B, L, d) padded lesion embedding matrix
        mask : (B, L) binary padding mask; 1 = padded position

        Returns
        -------
        out : (B, L, d) mask-refined lesion embeddings
        """
        B, L, d = PE.shape
        attn_mask = torch.zeros(B * self.attn.num_heads, L, L,
                                dtype=PE.dtype, device=PE.device)
        for b in range(B):
            for i in range(L):
                for j in range(L):
                    if mask[b, i] == 1 or mask[b, j] == 1:
                        attn_mask[b * self.attn.num_heads:(b + 1) * self.attn.num_heads,
                                  i, j] = float('-inf')
        attn_out, _ = self.attn(PE, PE, PE, attn_mask=attn_mask)
        out = self.ln(attn_out + PE)
        out = self.ffn(out)
        return out


# ─── SECTION 4: Weighted Feature Fusion Module (WFFM) ─────────────────────────

def weighted_feature_fusion(Em_prime: torch.Tensor, mask: torch.Tensor) -> torch.Tensor:
    """Aggregate MAL-refined lesion embeddings into a patient representation.

    Implements Section 3.3.3 (WFFM) of the paper.

    For the j-th feature dimension, the patient representation F(j)
    is a softmax-weighted sum of the j-th element across all valid
    lesion embeddings (Eqs. 11-12 in the paper).

    The softmax is applied dimension-wise across the k valid lesions,
    so that each dimension of F independently emphasizes the lesion
    that carries the most relevant information for that feature.

    Parameters
    ----------
    Em_prime : (B, L, d) MAL-refined padded embedding matrix
    mask     : (B, L) binary padding mask; 1 = padded position

    Returns
    -------
    F : (B, d) patient-level representation
    """
    valid_mask = (1 - mask.float()).unsqueeze(-1)     # (B, L, 1) 1=valid
    Em_masked = Em_prime * valid_mask                   # zero out padding
    weights = torch.softmax(Em_masked, dim=1)           # (B, L, d) softmax over lesions
    F_patient = (weights * Em_masked).sum(dim=1)        # (B, d)
    return F_patient


# ─── SECTION 5: Supervised Contrastive Loss ───────────────────────────────────

class SupervisedContrastiveLoss(nn.Module):
    """Supervised contrastive loss on lesion embeddings (Eq. 13-14).

    Positive pairs: lesions from the same artery within the same patient,
    or lesions with the same event label from different patients.
    Negative pairs: all other lesion pairs in the batch.

    Parameters
    ----------
    temperature : controls sharpness of similarity distribution (tau)
    """
    def __init__(self, temperature: float = 0.07):
        super().__init__()
        self.tau = temperature

    def forward(self, embeddings: torch.Tensor, labels: torch.Tensor) -> torch.Tensor:
        """
        Parameters
        ----------
        embeddings : (N, d) lesion embeddings across the batch
        labels     : (N,) event labels (0 or 1) for each lesion

        Returns
        -------
        loss : scalar supervised contrastive loss
        """
        embeddings = F.normalize(embeddings, dim=-1)
        sim = embeddings @ embeddings.T / self.tau       # (N, N)
        N = embeddings.size(0)
        pos_mask = (labels.unsqueeze(0) == labels.unsqueeze(1)).float()
        pos_mask.fill_diagonal_(0)
        neg_mask = 1 - pos_mask
        neg_mask.fill_diagonal_(0)
        denom = torch.log((torch.exp(sim) * neg_mask).sum(dim=1) + 1e-8)
        num_pos = pos_mask.sum(dim=1).clamp(min=1)
        loss = -(pos_mask * (sim - denom.unsqueeze(1))).sum(dim=1) / num_pos
        return loss.mean()


# ─── SECTION 6: Full AngioGraphCAD Framework ──────────────────────────────────

class AngioGraphCAD(nn.Module):
    """AngioGraphCAD: Full patient-level CAD events prediction framework.

    Architecture overview (Figure 1 in the paper):
      a. Image-to-graph pipeline     (Section 3.1)
      b. Lesion-level GNN backbone   (Section 3.2)
         GIN layers -> global pool -> FC projector -> [h_G || clinical]
         -> MLP -> y_lesion
      c. Patient-level fusion module (Section 3.3)
         MAL (masked-attention layer) -> WFFM -> FC -> y_patient

    Parameters
    ----------
    node_feat_dim  : per-node feature dimension from ICA image
    hidden_dim     : GIN hidden dimension (R_d in paper, default 256)
    embed_dim      : lesion graph embedding dimension
    clinical_dim   : clinical feature dimension (F_d in paper, default 64)
    num_classes    : number of output classes (2 for binary prediction)
    num_gin_layers : number of GIN message-passing layers (default 6)
    max_lesions    : maximum number of lesions per patient (padding length L)
    mal_layers     : number of MAL layers for patient-level fusion (default 6)
    """
    def __init__(self,
                 node_feat_dim: int = 4,
                 hidden_dim: int = 256,
                 embed_dim: int = 256,
                 clinical_dim: int = 64,
                 num_classes: int = 2,
                 num_gin_layers: int = 6,
                 max_lesions: int = 10,
                 mal_layers: int = 6):
        super().__init__()
        self.max_lesions = max_lesions
        self.embed_dim = embed_dim

        # GNN backbone (shared for lesion and patient level)
        self.lesion_gnn = LesionGNN(
            node_feat_dim=node_feat_dim,
            hidden_dim=hidden_dim,
            embed_dim=embed_dim,
            clinical_dim=clinical_dim,
            num_classes=num_classes,
            num_gin_layers=num_gin_layers,
        )
        # MAL: N masked attention layers for patient-level fusion
        self.mal_layers = nn.ModuleList([
            MaskedAttentionLayer(embed_dim + clinical_dim)
            for _ in range(mal_layers)
        ])
        # Patient-level MLP classifier
        patient_input = embed_dim + clinical_dim
        self.patient_classifier = nn.Sequential(
            nn.Linear(patient_input, patient_input // 2),
            nn.ReLU(),
            nn.Dropout(0.3),
            nn.Linear(patient_input // 2, num_classes),
        )

    def lesion_forward(self, graph: Data, clinical: torch.Tensor) -> Tuple[torch.Tensor, torch.Tensor]:
        """Lesion-level prediction (Eq. 3 in paper).

        Parameters
        ----------
        graph    : PyG Data object for one lesion
        clinical : (1, clinical_dim) clinical features for this lesion

        Returns
        -------
        logits : (1, num_classes)
        Em     : (1, embed_dim + clinical_dim) fused embedding for patient fusion
        """
        logits, h_G = self.lesion_gnn(graph, clinical)
        Em = torch.cat([h_G, clinical], dim=-1)
        return logits, Em

    def patient_forward(self,
                         Em_list: List[torch.Tensor],
                         mask: torch.Tensor) -> torch.Tensor:
        """Patient-level prediction via MAL and WFFM (Eqs. 4-5 in paper).

        Parameters
        ----------
        Em_list : list of k lesion embeddings, each (1, d+c)
        mask    : (1, L) binary padding mask; 1 = padded position

        Returns
        -------
        logits : (1, num_classes) patient-level event prediction
        """
        L = self.max_lesions
        d = Em_list[0].size(-1)
        PE = torch.zeros(1, L, d, device=Em_list[0].device)
        for i, em in enumerate(Em_list):
            if i < L:
                PE[0, i] = em.squeeze(0)
        # Apply MAL layers
        x = PE
        for mal in self.mal_layers:
            x = mal(x, mask)
        # WFFM: dimension-wise softmax fusion
        F_patient = weighted_feature_fusion(x, mask)
        return self.patient_classifier(F_patient)

    def compute_lesion_weights(self,
                               Em_list: List[torch.Tensor],
                               mask: torch.Tensor) -> torch.Tensor:
        """Compute per-lesion importance weights LW_i (Eq. 15 in paper).

        Returns
        -------
        LW : (k,) interpretable importance weight for each real lesion
        """
        L = self.max_lesions
        d = Em_list[0].size(-1)
        PE = torch.zeros(1, L, d, device=Em_list[0].device)
        k = min(len(Em_list), L)
        for i in range(k):
            PE[0, i] = Em_list[i].squeeze(0)
        x = PE
        for mal in self.mal_layers:
            x = mal(x, mask)
        valid_mask = (1 - mask.float()).unsqueeze(-1)
        Em_masked = x * valid_mask
        weights = torch.softmax(Em_masked, dim=1)
        LW = weights[0, :k].mean(dim=-1)
        return LW


# ─── SECTION 7: Smoke Test ─────────────────────────────────────────────────────

def _smoke_test():
    """End-to-end smoke test of AngioGraphCAD on synthetic ICA graph data.

    Verifies:
      - Delaunay graph construction from synthetic lesion node positions
      - GIN-based lesion embedding extraction with clinical feature fusion
      - Masked attention layer with binary padding mask
      - WFFM patient-level representation fusion
      - Lesion-level binary cross-entropy loss and backward pass
      - Patient-level composite loss (BCE + supervised contrastive)
      - Per-lesion importance weight computation
    """
    print("=" * 60)
    print("AngioGraphCAD Smoke Test -- Synthetic ICA Lesion Graphs")
    print("Paper: Sun et al., Medical Image Analysis 112 (2026) 104079")
    print("=" * 60)

    device = 'cuda' if torch.cuda.is_available() else 'cpu'
    print(ff"\nDevice: {device}")

    node_feat_dim = 4
    hidden_dim = 256
    embed_dim = 256
    clinical_dim = 64
    num_classes = 2
    max_lesions = 5
    n_nodes = 200

    def make_lesion(n=200):
        positions = np.random.rand(n, 2) * 100
        features = np.random.randn(n, node_feat_dim).astype(np.float32)
        graph = build_lesion_graph(positions, features)
        graph = graph.to(device)
        return graph

    model = AngioGraphCAD(
        node_feat_dim=node_feat_dim,
        hidden_dim=hidden_dim,
        embed_dim=embed_dim,
        clinical_dim=clinical_dim,
        num_classes=num_classes,
        num_gin_layers=6,
        max_lesions=max_lesions,
        mal_layers=6,
    ).to(device)

    total_params = sum(p.numel() for p in model.parameters())
    print(ff"Total parameters: {total_params:,}")

    optimizer = torch.optim.Adam(model.parameters(), lr=0.00115, weight_decay=0.08)
    contrastive_loss_fn = SupervisedContrastiveLoss(temperature=0.07)

    # ── Lesion-level forward pass ──
    model.train()
    graphs = [make_lesion(n_nodes) for _ in range(3)]
    clinicals = [torch.randn(1, clinical_dim, device=device) for _ in range(3)]
    lesion_labels = torch.tensor([1, 0, 1], device=device)

    Em_list, all_logits = [], []
    for g, c in zip(graphs, clinicals):
        logits, Em = model.lesion_forward(g, c)
        Em_list.append(Em)
        all_logits.append(logits)

    lesion_logits = torch.cat(all_logits, dim=0)
    lesion_bce = F.cross_entropy(lesion_logits, lesion_labels)

    all_Em = torch.cat(Em_list, dim=0)
    lesion_cl = contrastive_loss_fn(all_Em, lesion_labels.float())
    lesion_loss = lesion_bce + lesion_cl

    optimizer.zero_grad()
    lesion_loss.backward()
    optimizer.step()

    print(ff"\nLesion-level BCE:          {lesion_bce.item():.4f}")
    print(ff"Lesion-level ContrastLoss: {lesion_cl.item():.4f}")
    print(ff"Lesion-level Total Loss:   {lesion_loss.item():.4f}")

    # ── Patient-level forward pass ──
    k = 3
    mask = torch.zeros(1, max_lesions, dtype=torch.long, device=device)
    mask[0, k:] = 1

    with torch.no_grad():
        graphs2 = [make_lesion(n_nodes) for _ in range(k)]
        clinicals2 = [torch.randn(1, clinical_dim, device=device) for _ in range(k)]
        Em_list2 = [model.lesion_forward(g, c)[1] for g, c in zip(graphs2, clinicals2)]
        patient_logits = model.patient_forward(Em_list2, mask)
        patient_label = torch.tensor([1], device=device)
        patient_bce = F.cross_entropy(patient_logits, patient_label)
        patient_probs = torch.softmax(patient_logits, dim=-1)
        lw = model.compute_lesion_weights(Em_list2, mask)

    print(ff"\nPatient-level logits:      {patient_logits.detach().cpu().numpy().round(3)}")
    print(ff"Patient-level BCE:         {patient_bce.item():.4f}")
    print(ff"Event probability:         {patient_probs[0, 1].item():.3f}")
    print(ff"Lesion importance weights: {lw.cpu().numpy().round(3)}")
    print(f"{'─'*50}")
    print("Smoke test passed. AngioGraphCAD forward and backward OK.")
    print("See Algorithm 1-2 in Sun et al. 2026 for full training workflow.")
    print("=" * 60)


if __name__ == '__main__':
    _smoke_test()
What AngioGraphCAD Opens Up and Where the Gaps Remain
The cross-cohort generalization results across FAME2 and FCL tell a meaningful story about what AngioGraphCAD is learning. FAME2 patients have stable coronary artery disease with moderate stenosis severity. FCL patients have mild disease where FFR and diameter stenosis are explicitly noted to be less conclusive. The fact that AngioGraphCAD transfers well in zero-shot mode to this harder population, where clinical baselines perform worst, suggests the geometric representations being learned are capturing something fundamental about lesion morphology that does not depend on disease severity level.
The computational design choices that enable this generalization are worth examining. Building the lesion graph from all pixel-level nodes rather than downsampling to landmarks or keypoints means the geometric detail available to the GIN backbone is as rich as the annotation allows. The Delaunay triangulation edge construction reflects natural spatial adjacency rather than an arbitrary radius or k-nearest-neighbor rule, which means the graph topology encodes genuine tissue geometry rather than a data preprocessing artifact. And the GIN architecture itself has theoretical expressiveness advantages that matter when the discriminative signal lives in fine-grained structural patterns rather than aggregate statistics.
There are genuine limitations worth addressing. Both cohorts are relatively small by the standards of large-scale clinical AI validation, and the patient-level evaluation is restricted to FAME2 because the FCL design makes all patients eventual MI cases. The angiography imaging protocol in both datasets involves multiple 2D projections from different angles, but the number of usable projections varies by lesion and clinical workflow, and fewer projections mean less complete geometric coverage of the stenosis. The framework currently uses multiple 2D views through a view-adaptive prediction averaging scheme rather than reconstructing a true 3D geometry, which is an explicit limitation the authors flag for future work.
There is also a notable trade-off in the recall metric when clinical features are included alongside geometric features. The ablation results show that removing clinical variables drops AUC and F1 but increases recall slightly. The authors suggest this happens because clinical variables like age and comorbidity status encode systemic risk factors that may bias the model toward predicting conservatively on patients who appear globally healthy despite having geometrically problematic lesions. Since the framework produces continuous risk scores, this trade-off can be managed by adjusting the decision threshold in practice, but it points toward an interesting tension between geometric and systemic risk signals that future work could address through more sophisticated feature fusion.
The interpretability mechanism is one of the genuinely novel aspects of the framework. Because the weighted feature fusion module produces dimension-wise softmax weights over lesion embeddings, the relative importance of each lesion in the patient-level prediction can be read out directly as a scalar score per lesion. The observation that some two-year-negative lesions receive high importance weights at the five-year prediction horizon suggests the model is detecting early geometric signatures of lesions that will become clinically significant during the follow-up window between years two and five. That is a clinically meaningful capability if it can be validated prospectively, because it would allow the framework to flag lesions for closer monitoring before they cross the event threshold of standard clinical metrics.
The broader implication is about what assumptions we should build into cardiovascular AI. AngioGraphCAD encodes a specific claim about coronary risk that is grounded in decades of interventional cardiology practice. Lesion geometry matters beyond the single-point diameter measurement. The spatial organization of the stenosis, the curvature of the vessel, the contour of the lesion boundary, these carry prognostic information that neither FFR alone nor CNN texture features alone can fully capture. The results across 563 FAME2 patients and 83 FCL patients with a total of nearly 2000 annotated lesions provide meaningful evidence that this claim is correct. That is a more principled foundation for clinical decision support than a feature extractor trained to correlate image appearance with labels without any prior knowledge about the geometric structure of arterial disease.
Read the Full Paper and Code
The complete AngioGraphCAD paper with full experimental results, ablation studies, interpretability analysis, and site-wise generalization evaluation is available open access via ScienceDirect. The dataset and code repository are publicly available on GitHub.
Sun, X., Belmpas, T., Senouf, O., Abbé, E., Frossard, P., De Bruyne, B., Auberson, D., Muller, O., Fournier, S., Mahendiran, T., & Thanou, D. (2026). Future cardiovascular events prediction from invasive coronary angiography: A graph representation learning perspective. Medical Image Analysis, 112, 104079. https://doi.org/10.1016/j.media.2026.104079
This article is an independent editorial analysis of peer-reviewed research. The PyTorch implementation is an educational reproduction and may differ from the official repository in engineering details. For research use, verify against the original paper. This work was supported by the EPFL Center for Intelligent Systems and the EPFL AI Center under the grant “Next Generation Data Augmentation for Heart Attack Prediction.”