
Key Points
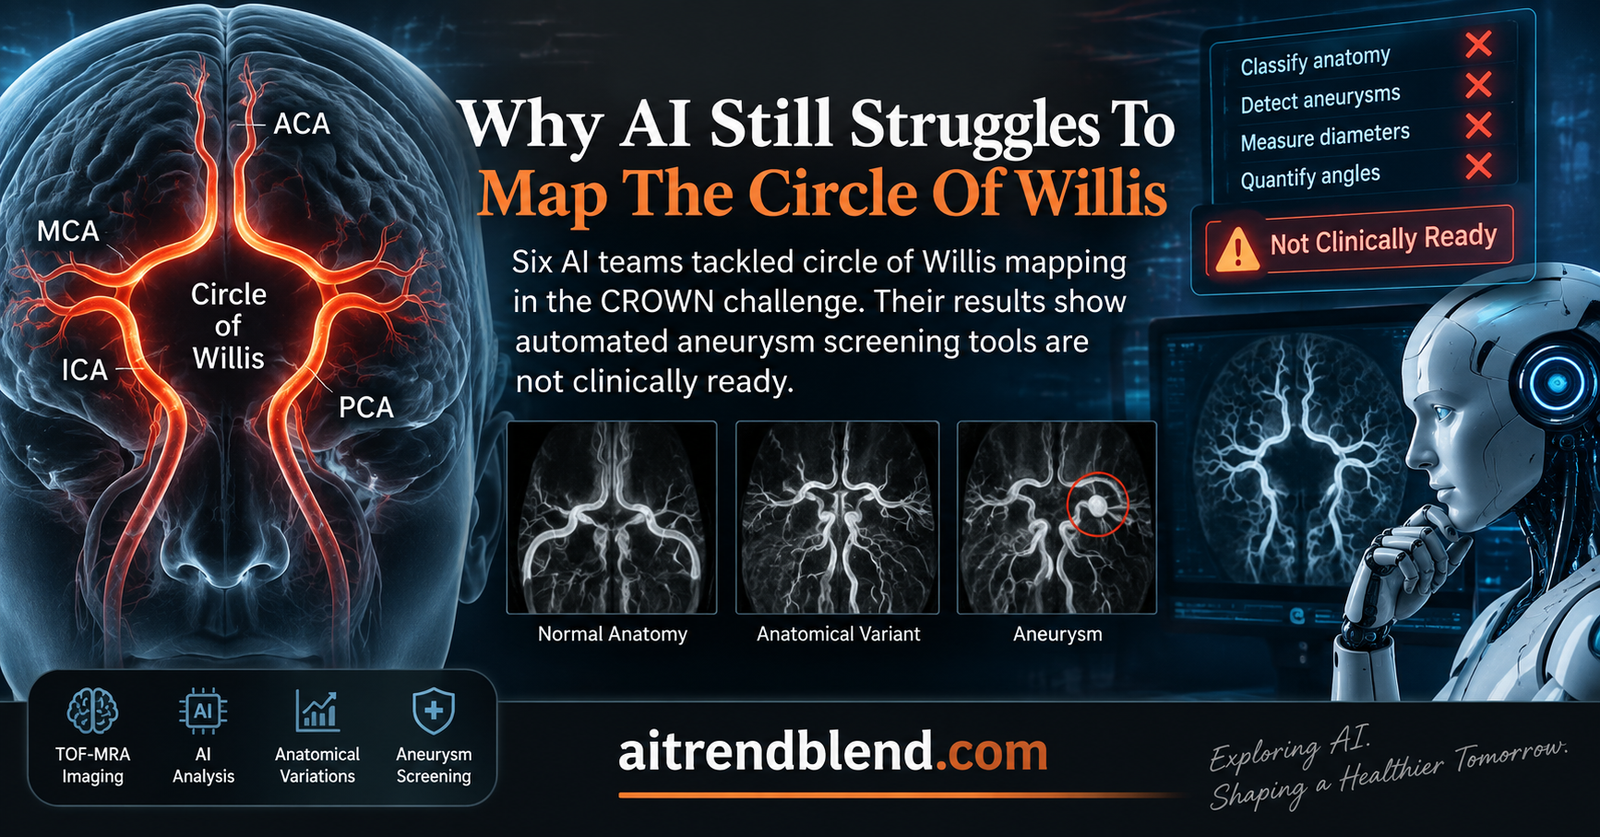
- The CROWN challenge asked six international teams to automatically classify circle of Willis anatomy and measure fifteen artery diameters plus ten bifurcation angles from 3D TOF-MRA brain scans.
- The best classification score reached a balanced accuracy of only 0.27, well short of the 0.72 to 0.77 agreement seen between two trained human annotators.
- Artery diameter measurement fared better, with the top team reaching a mean error of 0.44 millimeters, though bifurcation angle prediction stayed far less reliable.
- None of the submitted methods trained a single model beginning to end. Every team relied on a vessel segmentation step followed by a fixed geometric calculation.
- Performance dropped further when the same models were tested on scans from a different hospital, underlining how far this technology sits from real clinical deployment.
Not Medical Advice
This article explains a published research challenge. It is not medical advice, a diagnostic tool, or a treatment recommendation. If you or a family member has a history of brain aneurysms, talk to a qualified neurologist or radiologist about appropriate screening rather than relying on anything summarized here.
The screening problem that quietly persists
Intracranial aneurysms are small bulges that form on brain arteries, most often at the junctions inside the circle of Willis where blood flow splits and pressure concentrates unevenly. Most never rupture. Roughly three percent of the general population carries one without ever knowing it. The trouble is the minority that do rupture, which typically causes a subarachnoid hemorrhage, a stroke variant with a real chance of death or lasting disability and a heavy cost to families and health systems.
Because a family history of a ruptured aneurysm raises a relative’s own risk of carrying a dangerous one, clinics recommend long term screening for first degree relatives of patients who suffered a subarachnoid hemorrhage. The screening tool of choice is 3D time of flight magnetic resonance angiography, shortened to TOF-MRA throughout this piece, repeated roughly every five years because aneurysms can form at any point in adulthood.
Here is the part that rarely gets said plainly. Even with this screening protocol running for decades, the detection rate stays stubbornly high. Eleven percent of people get flagged with an unruptured aneurysm at their first screening, and eight percent at follow up rounds, according to the cohort study the CROWN team cites. That is not a small number of false reassurances or missed early warnings, it is a sign that a blanket five year interval treats every screened relative the same when their actual risk clearly is not the same.
What would let clinicians screen the highest risk people more often and the lowest risk people less often, or stop screening some of them altogether. A handful of studies have proposed that the physical shape of the circle of Willis itself carries that signal. An incomplete ring, missing or shrunken vessels, and unusual bifurcation angles have all been floated as markers tied to aneurysm development. The problem is that testing those ideas properly requires measuring thousands of scans by hand, and manual measurement of brain vessels is slow, tedious, and inconsistent even between two well trained observers looking at the same image.
What the circle of Willis actually looks like, and why it varies so much
The circle of Willis sits at the base of the brain, formed where the internal carotid arteries and the vertebrobasilar system meet and interconnect through a set of short connecting vessels. In a textbook drawing it looks like a clean, symmetric ring. In real patients it almost never is. One side’s anterior cerebral artery segment might be hypoplastic, meaning noticeably thinner than expected. A posterior communicating artery might be entirely absent on one side, a configuration doctors call a fetal type posterior cerebral artery because the vessel keeps a pattern that is typical before birth but usually regresses afterward.
These variants are not rare oddities. A complete, fully symmetric ring is closer to a minority pattern than the default once you look across a large screening cohort, which the CROWN paper’s own data confirms. That variability is exactly why classification matters for research on aneurysm risk. If two different studies use two different definitions of what counts as an incomplete or asymmetric circle of Willis, their reported prevalence numbers will not agree, and neither will their conclusions about which patterns actually predict trouble.
Grading circle of Willis shape with the Lippert and Pabst system
To keep classification consistent, researchers commonly reach for a scheme published by Lippert and Pabst in 1985, which sorts both the front, or anterior, half of the ring and the back, or posterior, half into ten separate categories each, labeled A through J. Class A on the anterior side describes the textbook complete pattern, a single anterior communicating artery with both internal carotid arteries splitting cleanly into their respective branches. Other classes capture duplicated connecting arteries, arteries that fuse together over a short stretch before splitting again, or one side being hypoplastic or missing outright.
A rival scheme from Lazorthes and colleagues, published in 1979, uses twenty two categories instead of twenty. Some studies skip formal classification entirely and describe variants in their own words. None of this is wrong exactly, but it makes comparing prevalence numbers across studies close to meaningless, since one paper’s incomplete circle might be another paper’s normal variant depending on which threshold or scheme they used. The CROWN organizers chose the Lippert and Pabst system specifically because it is widely cited, giving any automated method built against it a reasonable chance of being useful beyond a single lab.
Building a benchmark instead of one more isolated study
Rather than publish another single group’s method and claim it works, the Utrecht team behind CROWN, short for the Circle of Willis Intracranial Artery Classification and Quantification challenge, built a shared benchmark and invited outside groups to compete against a common, clinically annotated reference. The challenge ran through 2023 and culminated in a session at MICCAI, the main international conference for medical image computing, held that year in Vancouver.
Fifty teams from around the world signed the confidentiality agreement needed to access training data. Only six produced a final submission that made the deadline, representing five different countries and a mix of academic labs and small companies. Every team had to package its solution as a Docker container and submit it for evaluation against a held out test set they never saw directly, which is a meaningfully higher bar than reporting your own cross validation numbers, because it removes any chance of accidentally tuning a method to the exact test cases.
The data itself came from two long running Utrecht screening cohorts covering scans collected between 1996 and 2021, filtered down to 600 people whose most recent scan showed no diagnosed aneurysm. That detail matters. The organizers deliberately excluded people with known aneurysms so that a bulging vessel at a bifurcation would not distort the diameter or angle measurement at that exact spot. Three hundred scans went to training, another three hundred, fully separate, went to testing. Roughly eighty percent came from 3.0 tesla scanners and the rest from older 1.5 tesla machines, a realistic mix given how screening programs actually operate rather than a curated, single scanner dataset.
Two tasks made up the challenge. Task one asked for pure classification, assigning each scan one of ten anterior classes and one of ten posterior classes under the Lippert and Pabst scheme. Task two asked for regression, twenty five separate numbers per scan, the diameters of fifteen named arteries and the angles of ten named bifurcations, all measured in millimeters or degrees.
How the reference measurements were actually made
It is worth pausing on the annotation process itself, because it shapes how much weight the challenge results should carry. For task one, one annotator was a neuroradiologist with more than twenty years of experience, and a second annotator was trained specifically for this task under that radiologist’s supervision. For task two, three separately trained annotators measured diameters and angles using a semi automatic pipeline built in MeVisLab software. An annotator marked the rough location of an artery, a region growing algorithm traced its centerline, and a full width at half maximum analysis on a cross sectional image slice pinned down the actual diameter. Bifurcation angles came from a pretrained segmentation network that extracted vessel skeletons, from which the team computed the angle between two vessel directions at each junction.
Crucially, the organizers also measured how much even trained humans disagree with themselves and each other. Thirty scans were annotated twice by the same person to check consistency over time, and another thirty were annotated by two different people to check agreement between observers. For task one, the same annotator agreed with their own earlier call about 89 percent of the time on anterior classification and 85 percent on posterior classification, using balanced accuracy as the yardstick. Between two different annotators, that dropped to 77 percent and 72 percent. Most of the disagreement traced back to one specific judgment call, whether a connecting artery counted as hypoplastic or not, a distinction that depends on a threshold sitting close to the resolution limit of the scan itself.
For task two, diameter measurements agreed within roughly a quarter of a millimeter between repeat measurements and between different annotators, and bifurcation angle measurements agreed within about ten to twelve degrees. Those numbers become the honest ceiling against which every AI submission should be judged. A model cannot reasonably be expected to beat the humans who defined its ground truth.
Six teams, six different strategies
The methods submitted spanned a surprising range of technical approaches rather than converging on one obvious playbook.
Sibets and USTS won task one outright. Their pipeline normalized scan intensity, used region growing to find seed points for a rough vessel segmentation, cropped a bounding box around the circle of Willis, and trained two separate ResNet50V2 networks, one for the anterior classification and one for the posterior, with standard image augmentation like flipping and gamma shifts layered on top.
Snaillab won task two. Rather than build something new from scratch, they adapted an existing tool called eICAB, a convolutional network previously trained on 236 annotated scans to segment eighteen separate vessel labels around the circle of Willis. Diameters came from fitting spheres to the resulting binary vessel mask, followed by a harmonization step that recalibrated the raw measurements against CROWN’s own reference scale. Bifurcation angles came from skeletonizing both a whole brain segmentation and the circle of Willis segmentation, then computing vectors from the resulting junction points.
AIntropy tied for second on task one and took second on task two, using graph neural networks built on a vessel skeleton graph rather than the more common nearest neighbor graph construction. Notably, this was the only team that pulled in outside training data, adding scans from the public OASIS-3 dataset labeled in house with twenty four anatomical classes. That extra data likely explains their comparatively strong posterior classification performance, though it came at a cost. Because their in house labeling scheme did not include every anterior class from the Lippert and Pabst system, they could not attempt anterior classification at all.
Labcom I3M also tied for second on task one and took third on task two with an atlas based registration approach, aligning every incoming scan to a chosen reference image, then searching a small radius around each expected anatomical landmark to locate it on the patient’s own vessel skeleton.
The remaining three teams, agaldran_segs, agaldran_ims, and DCS_CUSAT, competed only in task one, using combinations of segmentation networks like Swin UNETR feeding into classifiers such as Densenet121 and EfficientNet B0, or in the case of DCS_CUSAT, a dual branch network that combined 3D volumetric features with 2D features from a maximum intensity projection image.
Worth Remembering
Every single submitted method relied on a vessel segmentation step followed by a fixed, hand coded geometric calculation to get from a segmentation mask to a diameter or an angle. Not one team trained a model to predict those numbers beginning to end, despite the challenge organizers explicitly encouraging that approach.
The numbers, and why the gap matters
The table below summarizes the headline results from the paper’s own ranking tables, reporting balanced accuracy for task one and mean absolute error alongside Pearson correlation for task two.
| Team | Task | Key Metric | Result |
|---|---|---|---|
| Sibets and USTS | Task 1, Anterior | Balanced accuracy | 0.26 |
| Sibets and USTS | Task 1, Posterior | Balanced accuracy | 0.27 |
| AIntropy | Task 1, Posterior | Balanced accuracy | 0.40 |
| Snaillab | Task 2, Diameters | Mean absolute error | 0.44 mm |
| Snaillab | Task 2, Angles | Mean absolute error | 28 degrees |
| AIntropy | Task 2, Angles | Mean absolute error | 16 degrees |
| Two human annotators | Task 1, Anterior | Balanced accuracy | 0.77 |
| Two human annotators | Task 1, Posterior | Balanced accuracy | 0.72 |
Task one, classification, lands far below human agreement
Across all six teams, balanced accuracy for classifying the anatomical variant landed somewhere between 0.11 and 0.40. Compare that to the 0.72 to 0.77 range two human annotators reached with each other, and the gap is stark. This was not a case of models missing by a little. Looking at per class recall and F1 scores tells a more specific story. Every method did reasonably well on the two most common patterns, the standard complete anterior configuration and the standard posterior configuration, simply because those classes dominate the training data. Rare classes told a different story entirely. Several teams, including both entries from the agaldran group, only ever predicted the two majority classes and never once guessed a minority variant correctly across the full three hundred scan test set.
F1 scores sat consistently lower than recall across nearly every team and class, a pattern that points to low precision. In plain terms, when a model did guess a rare class, it was frequently wrong, throwing out that label for scans that did not actually have it. A classifier that is both unreliable at spotting rare variants and prone to false alarms about them is not something a radiologist could safely lean on for the very cases where automated flagging would matter most, the unusual configurations that might carry real clinical signal.
Task two, quantification, gets closer but is not there yet
Artery diameter measurement showed more promise. The three teams that attempted task two landed mean absolute errors between 0.44 and 0.87 millimeters, with Snaillab’s adapted eICAB pipeline performing best across most individual arteries, particularly the A1 segment, M1 segment, P1 segment, internal carotid artery, and basilar artery, where median error dropped as low as 0.17 to 0.39 millimeters depending on the vessel. Bifurcation angle prediction proved harder across the board, with mean absolute errors ranging from 16 to 29 degrees, still noticeably wider than the roughly ten to twelve degree spread seen between two human annotators.
One result deserves particular attention because it reveals something about how these models actually behave rather than just how accurate they are on average. AIntropy’s angle predictions carried a moderate mean absolute error, which on its own would look reasonably competitive. But their Pearson correlation, a measure of whether predictions actually track the real variation between patients rather than just landing near the average value, came in extremely low. Digging into individual predictions, the paper’s authors found AIntropy’s model was repeatedly outputting close to the same discrete value for a given artery regardless of the actual patient. It had learned where to look, essentially localizing the right vessel or junction correctly, but not how to read the specific number at that location. That is a meaningfully different kind of failure than random noise, and it is the sort of thing that only shows up once you look past a single headline metric.
The current results fall short of meeting the criteria for clinical applicability compared to the inter and intra annotator metrics. Vos et al., Medical Image Analysis, 2025
What happened when the models saw a different hospital’s scans
Perhaps the most telling test came last. The organizers ran all six task one methods and all three task two methods against thirty additional scans borrowed from a separate public challenge, TopCoW, collected outside the original Utrecht cohorts. Generalization varied a lot by team. Sibets and USTS, the task one winner on the original test set, kept the best overall classification performance on this outside data too, though still at a modest level. Task two told a more encouraging story for one team specifically. Snaillab’s diameter and angle measurements held up reasonably consistently on the new data, suggesting their approach, built on a previously validated segmentation tool rather than a model trained narrowly for this one challenge, generalizes better than most.
Pearson correlation checks whether predicted values move with reference values across patients, independent of average error size. \( r = \frac{\sum (y_i – \bar y)(\hat y_i – \bar{\hat y})}{\sqrt{\sum (y_i – \bar y)^2}\sqrt{\sum (\hat y_i – \bar{\hat y})^2}} \)
The clinical translation gap
Every number in this paper needs to be read against the actual purpose behind it, which is not academic benchmarking for its own sake but improving how often at risk family members get scanned and how those scans get read. That purpose sets a specific, demanding bar. A tool meant to help decide whether someone’s screening interval should shrink or stretch cannot afford the kind of systematic blind spot these methods showed toward rare anatomical variants, because some of those rare variants are exactly the patterns earlier research has flagged as possibly linked to aneurysm risk. A method that only ever predicts the two most common classes is not a screening aid, it is closer to always predicting the average outcome and calling it done.
Diameter measurement sits closer to something usable, and the paper is candid about why. Every submitted method used a segmentation step followed by a deterministic geometric calculation rather than an end to end learned model, which tends to produce more stable, interpretable numbers even when accuracy is imperfect, since a clinician reviewing the output can at least see which vessel was measured and how. That transparency matters more in a medical imaging context than raw accuracy alone, because a wrong number a radiologist can sanity check is safer than a confident wrong number from an opaque model.
Regulatory and safety context is worth stating plainly here too. Nothing described in this paper is an approved diagnostic device, and the authors explicitly frame CROWN as an open benchmark rather than a finished clinical tool. Any future product built on these methods would need its own validation, its own regulatory pathway, and its own prospective testing on the specific population it intends to serve before it should influence a single screening decision.
Where the methods still break down, in more detail
Looking at the confusion matrices the authors published, a consistent pattern emerges across the weaker methods. When a model has not seen enough examples of a rare configuration, it does not fail gracefully by expressing uncertainty, it fails by defaulting to whichever common class looks closest. Team DCS_CUSAT’s anterior classifier, for instance, essentially split its guesses between the two dominant classes and almost never produced anything else, even for scans whose reference label was clearly something rarer. Labcom I3M and Sibets and USTS stood out as the two teams that actually got some traction on minority classes, both managing to correctly identify a handful of the rarer anterior patterns that other teams missed entirely, though still nowhere near a level a clinic could rely on.
The posterior classification results were somewhat more evenly distributed across classes than the anterior side, which the authors attribute partly to a less extreme class imbalance in the posterior labels. Even so, the two rarest posterior classes were correctly identified only a handful of times across the entire test set, and only by one team.
Worth Remembering
An ensemble built by combining the top three performing methods through simple majority voting actually performed worse than the single best method alone. Averaging together models that each have different, specific blind spots does not automatically cancel those blind spots out.
Honest limitations
Several limitations shape how much weight these results deserve, and the paper is unusually direct about most of them.
The most consequential is scale. Only six teams submitted final results for task one and just three attempted task two, a notably small field compared to other MICCAI challenges the authors cite for comparison, which had far larger participation. A smaller field means these rankings say less about the ceiling of what is technically possible and more about what a handful of specific groups managed within the challenge timeline.
The reference data itself carries known constraints. Arteries measuring below 1.2 millimeters in diameter were excluded from the ground truth entirely, based on prior research suggesting reliable measurement needs a vessel to span at least two image voxels, below which the scan resolution itself starts overestimating true vessel size. Two of the three task two teams, Snaillab and Labcom I3M, still predicted diameters below that excluded threshold, meaning some fraction of their apparent errors reflect this measurement floor rather than a genuine model failure. Rare anatomical variants with fewer than ten occurrences in the training data were also excluded outright to keep the class distribution usable for training, which the authors acknowledge limits how comprehensively any conclusion here can be said to cover the full range of real world circle of Willis anatomy.
Dataset bias runs in a specific direction too. All 600 scans came from two Utrecht based familial screening cohorts, collected on Philips scanners at a single center between 2008 and 2021. The generalization test against thirty outside scans is a meaningful check, but thirty scans from one additional source is a modest sample for concluding how these methods would behave across the full diversity of scanner vendors, acquisition protocols, and patient populations seen worldwide.
Finally, even the semi automatic reference measurements used for task two, while more consistent than fully manual annotation, are not a perfect gold standard. The authors note that fully manual measurement in an earlier study of theirs showed roughly twice the disagreement range seen here, which means the annotator variability reported in this paper likely understates how much genuine measurement uncertainty exists in circle of Willis imaging more broadly.
What would actually move this forward
The authors point toward a few concrete next steps rather than vague optimism. No team attempted a model trained beginning to end for either task, everyone routed through segmentation followed by geometry, and the paper explicitly wonders whether that reflects a real technical ceiling or simply what teams had time to build within a challenge deadline. Vision transformers get a specific mention as a plausible next architecture to try, on the logic that classifying a whole circle of Willis configuration depends on the joint pattern across multiple arteries at once, a genuinely global judgment that convolutional networks, built around local receptive fields, may be structurally worse suited for than an architecture designed to weigh relationships across an entire image.
The more actionable path may be the least flashy one. CROWN remains open for future submissions past the original MICCAI deadline, and the underlying training data stays available through DataverseNL under a research license. Larger, more diverse training cohorts, expanded to include the rare variants this round had to exclude, would let future teams close some of the class imbalance gap directly rather than working around it. Combining strategies, rather than picking one architecture and running with it, also gets floated as promising, given how differently the top three methods here succeeded and failed. A deep learning classifier paired with an atlas based sanity check, for instance, might catch each other’s specific blind spots in a way that simple majority voting across similar methods clearly failed to do in this challenge.
Conclusion
The honest headline from CROWN is that automated circle of Willis analysis is not ready to guide screening decisions today, and the paper says so itself rather than leaving that conclusion implicit. A balanced accuracy in the 0.11 to 0.40 range for anatomical classification, against a human benchmark sitting at 0.72 to 0.77, is not a rounding error, it reflects models that systematically miss the less common vessel configurations that clinical researchers have specifically flagged as potentially meaningful for aneurysm risk.
What this challenge got right, though, is arguably more important than any single accuracy number. It built a shared, clinically grounded benchmark where six independent groups had to prove their methods against data they never saw, using metrics chosen to handle real world class imbalance rather than metrics that would flatter a model for guessing the majority class. That kind of transparent, adversarial benchmarking is exactly what separates a field that is honestly measuring its own progress from one that is only ever comparing itself to its own best case demos.
There is a genuine conceptual shift worth sitting with too. Every winning approach here, across both tasks, leaned on interpretable intermediate steps, a vessel segmentation a human could inspect, a geometric rule a human could audit, rather than a single opaque model producing a number with no visible reasoning behind it. In a domain where a wrong answer could eventually influence how often someone gets screened for a life threatening condition, that preference for a method a clinician can partially check looks less like a limitation of current AI and more like a reasonable design choice worth keeping even as the underlying models improve.
The transferability question extends well past brain aneurysms. The same basic pipeline, segment a branching vessel network, extract its centerline, measure diameters and angles at defined landmarks, applies just as directly to coronary artery disease, pulmonary vessel disease, or any other vascular condition where geometry carries diagnostic weight. Whatever methodological lessons come out of further CROWN submissions will likely be worth watching even for researchers who never touch a brain scan.
None of that changes the near term reality for the specific screening problem that motivated this whole effort. Families with a history of aneurysmal hemorrhage are still being screened on a flat five year schedule today, without the benefit of an automated, validated tool to help personalize that interval based on circle of Willis shape. This challenge is a real, well documented step toward building that tool, and an equally honest accounting of how much distance remains before it exists.
Frequently Asked Questions
What is the circle of Willis and why does its shape matter for aneurysm risk
The circle of Willis is a ring of connected arteries at the base of the brain that supplies blood to most of the brain tissue. Its shape varies substantially between people, and researchers have proposed that certain variants, like an incomplete ring or unusually narrow connecting vessels, may correlate with a higher chance of developing a brain aneurysm, though the supporting evidence is still considered limited.
What does TOF-MRA stand for and why is it used for this kind of screening
TOF-MRA stands for time of flight magnetic resonance angiography, a type of MRI scan that highlights flowing blood without needing an injected contrast dye. It is the standard imaging method for screening family members of aneurysm patients because it can be repeated safely at regular intervals over many years.
How accurate were the AI models at classifying circle of Willis variants
The best performing team reached a balanced accuracy of 0.26 for the front half of the ring and 0.27 for the back half. Two trained human annotators agreed with each other at rates of 0.72 to 0.77 on the same task, so the AI models remain well below human level consistency, particularly on rare anatomical patterns.
Did any team measure artery diameters accurately enough for clinical use
The top team for that task reached an average error of 0.44 millimeters per artery, which is closer to clinical usefulness than the classification results but still wider than the roughly quarter millimeter agreement seen between human annotators, and the paper explicitly states the overall performance does not yet meet clinical standards.
Why did none of the teams train a single end to end deep learning model
Every team instead used a vessel segmentation step followed by a fixed geometric calculation to derive diameters or angles. The paper’s authors suggest this may reflect either a genuine technical challenge in learning such fine grained, few voxel measurements directly, or simply that teams found the segmentation plus geometry approach more practical within the challenge timeline.
Is this technology currently used in hospitals to screen for brain aneurysms
No. CROWN is a research benchmark, not an approved clinical tool, and the authors are explicit that none of the submitted methods currently meet the standard needed for clinical implementation. Screening decisions today still rely on manual review by trained radiologists and neurologists.
Read the full peer reviewed paper, including every confusion matrix and per artery breakdown referenced above, or explore the training data yourself.
This analysis is based on the published paper and an independent evaluation of its claims.
Pingback: ElastoNet 1: The Revolutionary Neural Network for MRE Wave Inversion with Uncertainty Quantification (Pros & Cons) - aitrendblend.com