
Key points
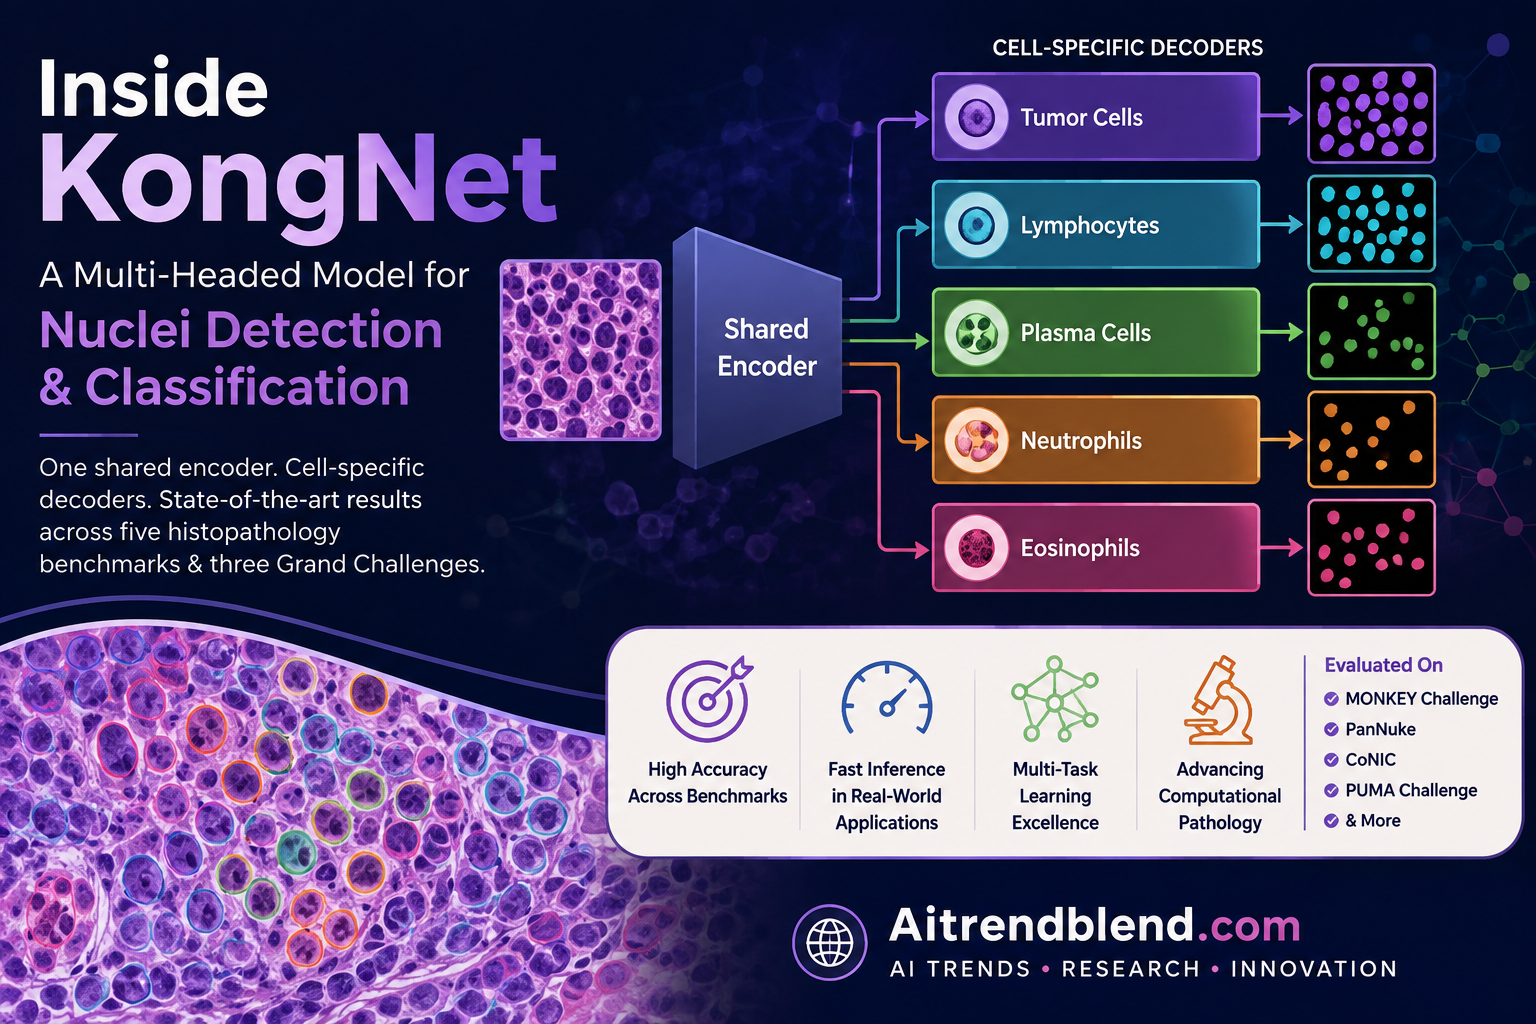
- KongNet gives every cell type its own decoder branch off a shared encoder, instead of asking one decoder to output every class.
- It won first place for inflammatory cell detection in the MONKEY Challenge and placed second on subtype classification, then went on to set new state of the art results on the public PanNuke and CoNIC datasets.
- A lightweight detection only variant, KongNet Det, won the 2025 MIDOG Challenge for mitosis detection, a completely different task from the one KongNet was designed for.
- An ablation study shows the multi decoder design helps most when target cell classes are hard to separate by shape, and helps less when they are already visually distinct.
- The model still struggles with classification decisions that require broader tissue context, such as telling apoptotic cells apart from immune cells inside necrotic tissue.
The problem hiding inside a routine biopsy
Start with the kidney transplant case, because it is the one that motivated this whole project. When a transplanted kidney is rejected, pathologists grade the severity using the Banff classification, a system built around seventeen lesion scores. Ten of those scores depend on counting and locating inflammatory cells across different compartments of the kidney. The Banff system does not, however, distinguish between lymphocytes and monocytes, even though the two cell types play different roles in the immune response. That gap exists partly because it is genuinely hard to separate them by eye in PAS stained tissue, where the cytoplasm around each nucleus is left unstained. Pathologists who need that distinction reliably tend to fall back on immunohistochemistry staining with CD3 and CD20 antibodies, which is a separate, slower process.
A second, unrelated version of the same underlying problem shows up in oncology. Tumor infiltrating lymphocytes, or TILs, correlate with patient outcomes across many cancer types, but the correlation runs in different directions depending on the cancer. A higher percentage of TILs is linked to better outcomes in triple negative breast cancer, and the opposite pattern shows up in HR positive, HER2 negative subtypes. Making sense of that requires large scale, consistent counting of immune cells across many slides, which is not something a room full of pathologists can do by hand at scale.
Both problems reduce to the same computational task. Find every nucleus in an image, decide what kind of cell it belongs to, and do this over gigapixel whole slide images that can contain millions of nuclei. The MONKEY Challenge, organized around a PAS stained kidney biopsy dataset, was launched specifically as a public benchmark for the lymphocyte and monocyte version of this problem, and it became the dataset that shaped KongNet’s design.
Why a single shared decoder was not good enough
Prior architectures in this space mostly funnel every cell class through the same decoder. HoVer Net, a widely used baseline from 2019, uses a shared encoder and three decoders that jointly handle binary segmentation, classification, and horizontal and vertical gradient maps used to separate touching nuclei through a Watershed step. StarDist, the winner of the original CoNIC Challenge, predicts radial distances and per pixel class probabilities from a multi head U Net. HoVer NeXt swaps in a ConvNeXt encoder and merges tasks to speed things up. DualU Net strips the design down to two decoders and drops Watershed entirely, at some cost to classification accuracy.
The pattern across all of these is that one decoder, or a small shared set of decoders, has to learn features useful for every cell type at once. The Warwick team’s argument is that this creates interference. A feature that helps separate a neutrophil from the background is not necessarily the same feature that helps separate a lymphocyte from a monocyte, and forcing one decoder to serve every class at once can blur the fine grained morphological cues that actually matter for the hardest distinctions.
KongNet’s answer is architecturally simple to state. Keep one shared EfficientNetV2-L encoder, pretrained on ImageNet, so the model still learns general purpose nucleus features early on. Then split off into one decoder per cell class. Each decoder specializes entirely in its own target type and does not have to compromise with the others.
How the architecture actually works
Each of KongNet’s decoders is composed of five decoder blocks that progressively upsample features back to the resolution of the input image. Inside every block, three design choices do the heavy lifting. Spatial and Channel Squeeze and Excitation modules, referred to as SCSE attention, recalibrate the feature maps channel by channel and spatially. PixelShuffle upsampling rearranges information from the channel dimension into spatial dimensions rather than relying on interpolation, which the authors argue preserves detail better than the alternative. And SiLU activation is used throughout for smoother gradient flow during training.
Each decoder is trained on three simultaneous tasks rather than one. The primary task is centroid detection, a binary mask of dilated nucleus centers. Two auxiliary tasks ride alongside it. Nuclei segmentation predicts the full shape of each nucleus, and contour segmentation predicts just the boundary. The authors frame the auxiliary tasks as a way to force the decoder to learn morphological detail it would not necessarily need if it only had to find centroids. Because the primary output is a centroid map, KongNet localizes nuclei by finding local maxima in that map and running non maximum suppression, which means it skips the Watershed post processing step that HoVer Net style pipelines depend on.
Not every dataset used in this study came with ready made segmentation masks. The MONKEY dataset only provides centroid dot annotations, so the team generated instance segmentation masks for it using NuClick, an interactive segmentation model pretrained on PanNuke, then derived contour masks from those using a Sobel filter based gradient method. Centroids get converted into detection targets by dilating each dot with an elliptical structuring element, sized at eleven pixels at 0.24 microns per pixel resolution, chosen to roughly match the physical size of a human nucleus without overlapping neighbors.
The overall loss function sums a weighted, class specific loss across all C classes plus a global inter class exclusion term.
$$L = \sum_{k=1}^{C} \lambda_k \cdot L_{Class\_k} + L_{Interclass}$$Each class specific loss combines the centroid loss with segmentation and contour losses, with the contour term downweighted since it mainly guides segmentation rather than standing on its own.
$$L_{Class\_k} = L_{Centroid\_k} + L_{Seg\_k} + 0.5 \cdot L_{Contour\_k}$$Centroid loss combines Jaccard, Dice, and Focal loss, so overlap and hard to detect nuclei both get addressed.
$$L_{Centroid\_k} = L_{Jaccard\_k} + L_{Dice\_k} + L_{Focal\_k}$$The inter class exclusion term multiplies predicted probabilities across all classes at each pixel, pushing the model toward a winner takes all output rather than letting multiple class decoders fire on the same pixel at once.
$$L_{Interclass} = \frac{1}{N} \sum_{i=1}^{N} \prod_{k=1}^{C} p_{k,i}$$For balancing the class specific weights λk, the team used two different strategies depending on the dataset. On MONKEY and PUMA, they treated the weights as learnable parameters using an uncertainty based weighting scheme. On PanNuke and CoNIC, they switched to fixed equal weighting instead, because the dynamic approach was found to suppress the learning signal for rare classes on those two datasets. That is a small but telling detail. It means there was no universal recipe here, the right weighting strategy depended on how the class imbalance looked in each dataset.
Class imbalance itself gets a separate fix. The team adapted a pixel level sampling strategy from HoVer NeXt that oversamples patches containing rarer cell types, weighted by the inverse frequency of each class across the training set. Two modifications were needed to make it work here. Since MONKEY has no segmentation masks, class prevalence gets estimated by multiplying the number of annotated nuclei by an average nucleus area rather than by measuring pixel coverage directly. And patch weights get log normalized to avoid extreme sampling probabilities for very rare or very common classes.
Results across three Grand Challenges
The headline result is the MONKEY Challenge final leaderboard. KongNet, run as a wider variant with expanded decoder channel capacity, took first place in overall inflammatory cell detection with an FROC score of 0.3930, and first place in lymphocyte detection specifically at 0.4624. On monocyte detection it placed second at 0.2392, behind a team called InstanSeg plus Classifier that had access to more than two million synthetically generated annotations pulled from IHC stained images, a resource advantage the KongNet team did not have. The final test set introduced two previously unseen medical centres, and KongNet’s lymphocyte and monocyte scores actually improved from the preliminary to the final phase despite that domain shift, which the authors read as a sign of genuine generalization rather than overfitting to the preliminary test cases.
| Team | Inflammatory cells | Lymphocytes | Monocytes |
|---|---|---|---|
| KongNet (Wide) | 0.3930 | 0.4624 | 0.2392 |
| InstanSeg + Classifier | 0.3875 | 0.4515 | 0.2626 |
| AIRA Matrix | 0.3517 | 0.4471 | 0.1906 |
| ST Medical | 0.3316 | 0.3935 | 0.1268 |
| Organizer baseline, Faster R CNN | 0.2282 | 0.3120 | 0.1220 |
On the CoNIC dataset, which covers six cell types across sixteen medical centres, KongNet reached a class average F1 of 0.653, ahead of the original CoNIC Challenge winner StarDist at 0.616 and every other published method the authors compared against. It took the top score in five of the six categories, with StarDist holding a small edge only on plasma cells, 0.612 against KongNet’s 0.596. On PanNuke, a nineteen tissue type benchmark, KongNet’s class average F1 of 0.674 again led the field, ahead of the transformer based CellNuc DETR at 0.618 and HoVer Net at 0.504. The pattern in the PanNuke breakdown is worth sitting with. KongNet’s advantage was largest on inflammatory, connective, and dead cells, categories defined mostly by how the nucleus itself looks, while CellNuc DETR performed best on neoplastic and epithelial cells, categories where the surrounding tissue architecture carries more of the signal. A convolutional, locally focused model and a transformer with broader receptive fields are apparently picking up different kinds of evidence.
The PUMA Challenge, built on H&E stained advanced melanoma tissue, gave KongNet a harder test because the team only fine tuned their MONKEY trained weights on PUMA within a limited time window rather than starting fresh. On Track 1, a three class detection task covering tumor cells, lymphocytes, and everything else, KongNet placed third on the final leaderboard with a macro average F1 of 0.6466, while still posting the best lymphocyte detection score among all entrants at 0.6746. Track 2 raised the difficulty to ten cell categories, and KongNet placed second overall with a macro average F1 of 0.2656, just behind the winning team’s 0.2707. The gap traces mostly to rare and ambiguous classes such as apoptotic cells, where the winning team’s multi stage pipeline explicitly incorporated tissue level segmentation to guide its classification decisions, something KongNet’s current design does not do.
Finally, a lightweight variant called KongNet Det, which drops the auxiliary segmentation and contour tasks and predicts only centroids, was entered into the entirely separate 2025 MIDOG Challenge for mitosis detection. It took first place on the final leaderboard with an F1 score of 0.7400, on a test set deliberately built to be hard, spanning twelve tumor types across human and veterinary cases including necrotic and inflamed regions. That result matters beyond the score itself. It suggests the underlying architectural choices, the attention modules, the upsampling method, the loss composition, generalize to a cell detection task that has nothing to do with lymphocytes or kidneys.
The ablation study that explains when specialization actually helps
This is where the paper goes further than most architecture papers bother to. Rather than stopping at showing KongNet beats a single decoder baseline, the authors asked why the size of that advantage varies so much between datasets. On MONKEY, the multi head design clearly outperformed the single head variant, KongNet SH, across all three categories, improving inflammatory cell FROC from 0.3263 to 0.3537, lymphocyte FROC from 0.3902 to 0.3950, and monocyte FROC from 0.2208 to 0.2407. On PanNuke, the two variants landed almost on top of each other, with class average F1 scores of 0.674 for the multi head model against 0.672 for the single head one.
To explain the gap, the team measured how separable the target classes actually are in feature space, using a Davies Bouldin index computed over both hand crafted shape descriptors and deep features from an ImageNet pretrained ResNet18. Lower Davies Bouldin values mean tighter, better separated clusters. On MONKEY, lymphocytes and monocytes came out poorly separated, with Davies Bouldin indices of 6.74 in shape feature space and 7.57 in ResNet18 feature space. On PanNuke, most class pairs separated far more cleanly, with one clear exception, neoplastic versus epithelial cells, which scored 11.61 and 8.32 on the same two measures, the worst separation in that dataset, and correspondingly the pair where the multi head design provided the most benefit. The pattern held together. Specialized decoders earn their complexity when the target classes actually look alike, and contribute less when the classes are already visually distinct.
A second ablation checked whether SCSE attention modules were pulling their weight, and the answer was a qualified yes. Adding SCSE to the full KongNet architecture raised monocyte FROC on MONKEY from 0.2170 to 0.2407 and lifted the PanNuke class average F1 from 0.656 to 0.674. The gains were smaller for the single decoder variants, which the authors read as evidence that attention modules matter more when a decoder is already specialized and just needs help refining fine detail, rather than when it is trying to do everything at once.
Where the model still gets confused
The paper does not gloss over KongNet’s failure modes, and the ones it documents are informative. In necrotic tissue regions from the PUMA Track 2 evaluation, the model regularly confused apoptotic cells with tumor cells and with other immune cell types. The authors’ explanation is plausible on its face, apoptotic cells often have fragmented nuclei that can resemble the small rounded nuclei of lymphocytes, and the training data likely contained relatively few examples of necrotic regions to begin with. Separately, KongNet struggled to distinguish tumor cells from epithelial cells in epidermal regions, two categories that share overlapping morphological features. Both failure patterns point toward the same missing ingredient, tissue level context. A pathologist looking at a necrotic region already knows apoptotic cells are more likely there. KongNet, as currently built, has no equivalent mechanism, since it makes its decisions purely from local nucleus appearance.
This connects directly to why the PUMA Track 2 winning team beat KongNet on the hardest classes. Their pipeline explicitly folded tissue segmentation predictions into the cell classification step, at the cost of running five separate models with several manually defined ensemble rules stitching them together. KongNet, in its published form, does not attempt anything like that. The authors are fairly direct about treating this as the clearest open direction for future work, describing plans to combine KongNet with a separately published tissue segmentation model from the same lab.
What this means for building on top of KongNet
On raw efficiency, the numbers are worth noting for anyone thinking about deployment rather than leaderboard rank. Benchmarked on a full whole slide image containing roughly 274 square millimeters of tissue, KongNet on a modest RTX 3060 workstation completed inference without test time augmentation in 8 minutes, and in 26 minutes using four fold test time augmentation, which the authors describe as the best practical tradeoff between accuracy and speed. Running the same workload with sixteen fold test time augmentation, the setting used to report the headline benchmark numbers, took 94 minutes. For comparison, the 699 million parameter CellViT SAM H model failed to run at all on that workstation due to memory errors, which is a real world constraint that matters more to a hospital IT department than a leaderboard score does. On an NVIDIA V100 equipped high performance node, KongNet’s forward pass latency was measured at 0.0378 seconds, about four times faster than CellViT SAM H’s 0.1510 seconds despite CellViT having far more parameters.
Honest limitations
A few limitations are worth being specific about, using the paper’s own numbers rather than vague caveats. The MONKEY training set covers 81 cases from four medical centres, and the final test set adds cases from two centres never seen during training, a meaningful but still modest scale for a task meant to eventually support kidney transplant grading. On the monocyte class specifically, KongNet was outperformed by a competitor that had access to over two million synthetic annotations, which suggests KongNet’s own monocyte performance may be data limited rather than architecture limited, and that more training examples for this specific under represented class could move the number further. The PUMA Track 2 result, a macro average F1 of just 0.2656 across ten classes, is a reminder that fine grained ten way cell classification in melanoma tissue remains genuinely difficult for every method tested, KongNet included, and none of the entrants in that track were close to what would be considered reliable for unsupervised clinical use. Finally, every comparison in this paper uses each method’s own reported numbers or the original leaderboard results, following each dataset’s official evaluation protocol, which means comparisons across datasets, rather than within a single leaderboard, should be read with some caution since matching radii and scoring rules differ by challenge.
The CNN versus transformer question this paper raises
One of the more interesting threads running through the discussion section is a comparison between KongNet’s convolutional design and transformer based competitors like CellViT and CellNuc DETR. The pattern that emerges across PanNuke and MONKEY is that KongNet’s CNN backbone wins when classification hinges on the nucleus’s own shape and texture, while ViT based models pull ahead when broader tissue architecture provides useful context, as with neoplastic versus epithelial cells in PanNuke. The authors ran a direct test of this within their own framework too, comparing CNN and transformer backbones for KongNet on the MONKEY dataset, and found the CNN based EfficientNetV2-L encoder still came out ahead there. Their conclusion leans toward hybrid designs as the likely next step, architectures that combine local morphological detail extraction with some mechanism for incorporating wider spatial context, rather than picking one paradigm and discarding the other.
Conclusion
KongNet’s core contribution is not a single flashy trick. It is a disciplined architectural choice, giving each cell type its own decoder rather than making one decoder serve them all, paired with an unusually thorough attempt to explain when that choice actually pays off. The multi task learning setup, forcing each decoder to also predict segmentation and contour masks alongside centroids, and the SCSE attention modules both show measurable, if uneven, benefits across the five datasets tested here.
The more interesting conceptual shift is the Davies Bouldin analysis tying decoder specialization to feature space separability. That is a testable, transferable idea. Anyone designing a multi class detection system in a different domain now has a concrete way to ask, before building anything, whether their classes are similar enough that specialized decoders are worth the added complexity, rather than assuming more parameters automatically help.
KongNet’s transfer to the 2025 MIDOG mitosis detection challenge, an entirely different cell detection task, through the lightweight KongNet Det variant, is the strongest evidence in the paper that these design principles are not narrowly tied to lymphocyte and monocyte classification. Winning that challenge with a model that dropped the auxiliary segmentation and contour tasks entirely also suggests the core architectural ideas, the encoder decoder split and the attention modules, carry more of the weight than the multi task training scheme does, at least for pure detection tasks.
The honest remaining gap is tissue context. KongNet’s failure cases, confusing apoptotic cells with immune cells in necrotic regions, struggling with tumor versus epithelial cells in epidermal tissue, all trace back to decisions that a pathologist would make by looking at the surrounding tissue, not just the nucleus in isolation. The PUMA Track 2 winning team’s advantage came precisely from building that context in, at the cost of a much more complicated five model pipeline. The authors’ own stated next step, combining KongNet with their separately published tissue segmentation model, is a direct acknowledgment of this gap rather than a marketing flourish.
Taken as a whole, this is a paper about the tradeoffs of specialization in medical image analysis, tested honestly across three Grand Challenges and two public benchmarks rather than optimized narrowly for a single leaderboard. Whether the multi decoder pattern becomes a standard building block for future nuclei detection systems will likely depend on whether other teams can replicate the same finding, that specialization pays off most exactly where classes are hardest to tell apart, on datasets beyond the ones tested here.
Complete PyTorch implementation and smoke test
Below is a full, runnable reimplementation of KongNet’s core components, the SCSE attention module, the PixelShuffle based decoder block, the specialized per class decoders, and the composite loss function described in the paper, including the Jaccard, Dice, and Focal centroid loss, the BCE plus Dice segmentation and contour loss, and the inter class exclusion term. It uses a small stand in encoder rather than the full EfficientNetV2-L to keep the smoke test fast, but the decoder architecture and loss functions match the paper’s equations directly. The smoke test builds a two class model, runs a forward pass on random input, confirms output shapes and probability ranges, and runs five optimization steps to confirm the loss actually decreases.
The full inference pipeline, pretrained weights, and this code are publicly released by the original authors.
Frequently asked questions
What is KongNet used for
KongNet detects and classifies individual cell nuclei in histopathology images. It was originally built for lymphocyte and monocyte detection in PAS stained kidney biopsies, then validated on melanoma, general cancer tissue, and mitosis detection tasks as well.
How is KongNet different from HoVer Net
HoVer Net uses a shared encoder with a small set of decoders that handle every cell class together, plus a Watershed post processing step. KongNet gives each cell class its own decoder and skips Watershed by localizing nuclei directly from predicted centroid maps.
Did KongNet outperform every other model tested
No. It placed second on monocyte detection in the MONKEY Challenge, behind a team using far more synthetic training data, and it placed second overall in the PUMA Track 2 ten class challenge, behind a team whose pipeline used tissue context that KongNet does not currently incorporate.
Is KongNet ready to use in a hospital setting
No. This is a research model validated on Grand Challenge benchmark datasets with controlled annotation and scanning protocols. It has not gone through clinical validation, regulatory review, or integration testing needed for diagnostic use, and it is not a substitute for a qualified pathologist.
What is the SCSE attention module doing inside the decoder
Spatial and Channel Squeeze and Excitation attention recalibrates feature maps along both the channel dimension and the spatial dimensions, helping the decoder emphasize the most informative parts of the feature map before producing its final prediction.
Why does the multi decoder design help more on some datasets than others
The authors measured how separable target cell classes are in feature space using a Davies Bouldin index. Classes that look similar, like lymphocytes and monocytes in PAS stained tissue, benefit the most from having a dedicated decoder. Classes that are already visually distinct see a smaller benefit.
This analysis is based on the published paper and an independent evaluation of its claims.