
Key points
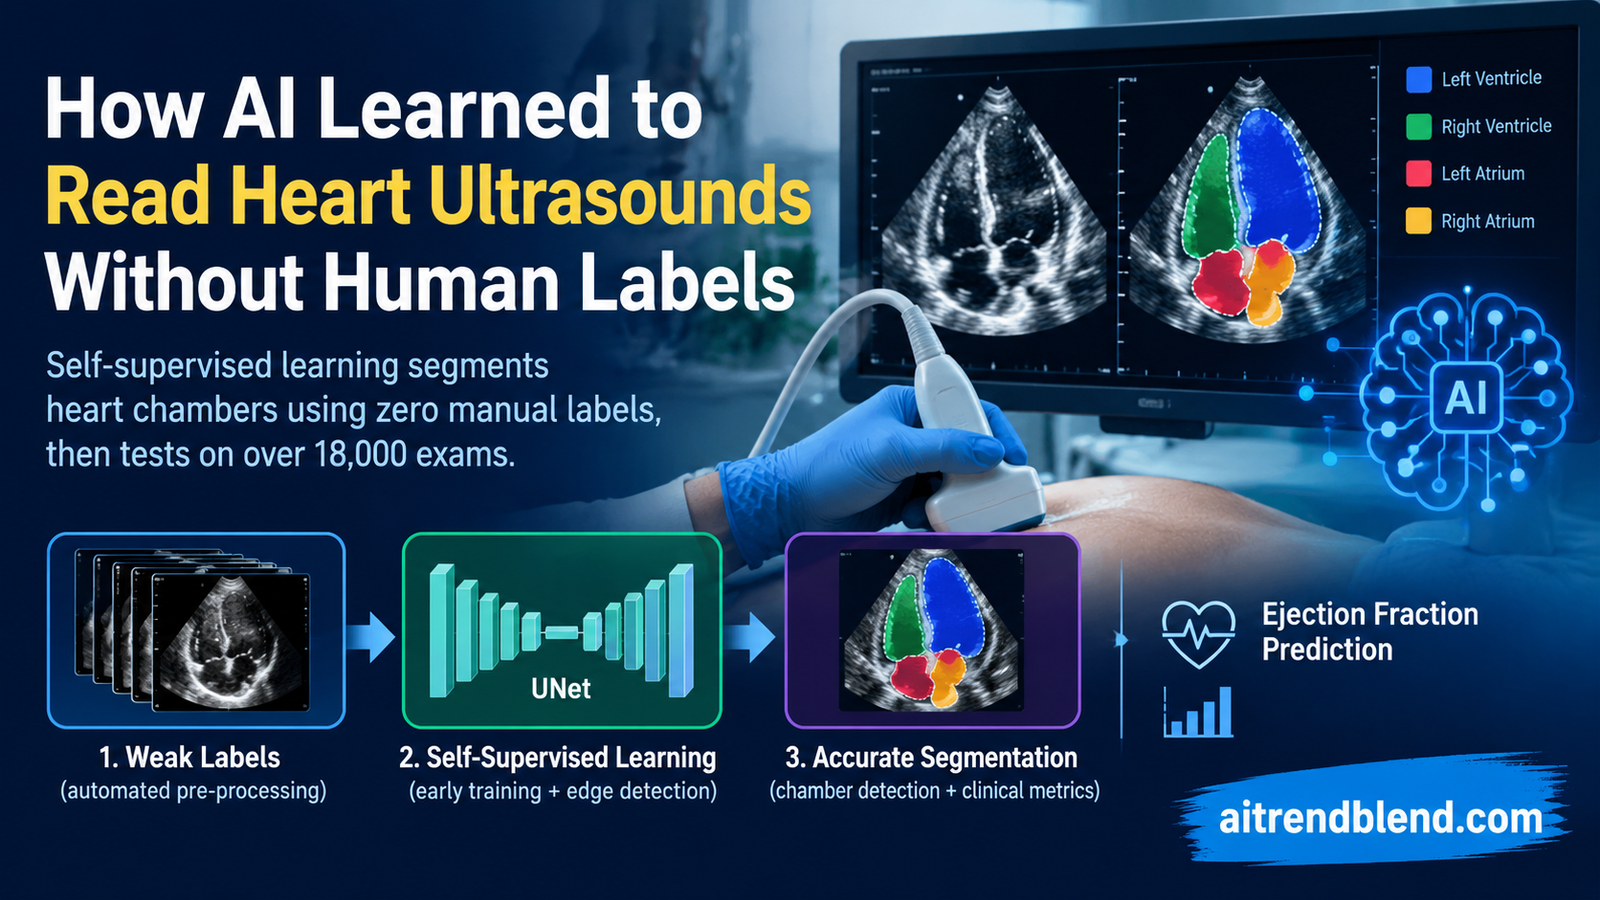
- Researchers at UCSF built a segmentation pipeline for echocardiograms that used zero manual chamber annotations, relying instead on computer vision and clinical shape knowledge to generate its own starting labels.
- The pipeline trained on only 450 echocardiograms and was tested on 18,423 exams, including an external dataset of 10,030 patients, making the test set more than forty times larger than the training set.
- Chamber measurements from the pipeline correlated with clinical echocardiogram readings at levels comparable to how much two human clinicians typically disagree with each other.
- Left ventricle segmentation reached an average Dice score of 0.89 against manual tracings on an external public dataset, inside the range reported for agreement between two different human readers.
- The system estimated it would have taken a human 1,664 hours to manually label every chamber in the 450 training studies across all three views, a labor cost the pipeline never had to pay.
- Left ventricle mass and right ventricle measurements remained the weakest points, echoing known reproducibility problems in the clinical literature rather than a unique flaw of the AI system.
The labeling problem nobody wants to admit is this expensive
Every echocardiogram report that lists an ejection fraction, a chamber volume, or a wall thickness represents a human being drawing a line around a moving, low contrast, occasionally noisy structure on ultrasound. Clinical guidelines from the American Society of Echocardiography call for careful chamber tracing across multiple views and multiple points in the cardiac cycle, and the resulting numbers feed directly into diagnosis and treatment decisions for heart failure, valve disease, and countless other conditions. The problem is that this tracing work does not scale, and it is not even fully consistent when it does happen. Studies cited in the paper describe meaningful disagreement between two cardiologists reading the same study, and between the same cardiologist reading the same study twice on different days.
Deep learning looked like an obvious fix until you notice what supervised segmentation models actually need to learn from. They need thousands of manually traced images, which means the labeling burden does not disappear, it just moves upstream to whoever built the training set. Worse, because tracing is subjective, a supervised model trained on one expert’s outlines inherits that expert’s particular habits and blind spots. Multiple independent labelers are often recommended specifically to average out individual bias, which raises the cost further. An entire commercial industry exists purely to produce manual labels for machine learning, which tells you something about how unsolved this bottleneck really is.
Most published segmentation work on the heart has quietly avoided the hardest version of the problem by focusing almost entirely on the left ventricle, the chamber clinicians already prioritize. The right ventricle and the left atrium, both clinically important, both harder to trace consistently, get left out because nobody wants to pay for that much additional labeling. The UCSF team, led by Danielle Ferreira and Rima Arnaout, decided to attack the root cause instead of working around it. If manual labels are the bottleneck, what happens if you remove them entirely and let the network teach itself using signals that already live inside the image and inside basic anatomical knowledge about how a heart is shaped.
Why self supervision is unusually hard on ultrasound
Self supervised learning has worked well in photographic imaging, where a network can learn useful structure by predicting missing patches of a photo or by contrasting two augmented views of the same picture. Ultrasound is a rougher environment for that trick. Speckle noise, shadowing, and inconsistent probe angles mean that the kind of pixel level self consistency that works for a photo of a cat does not transfer cleanly to a beating heart imaged through a rib cage. Prior attempts in biomedical imaging generally reduced the amount of manual labeling required rather than removing it, because the acceptable margin of error in medicine is tight enough that fully unsupervised methods kept falling short. The authors confirmed this themselves early on, noting that computer vision alone, without any learning component, produced chamber measurements that correlated poorly with clinical readings. That finding is what pushed them toward a hybrid design rather than a purely algorithmic one.
How the pipeline actually teaches itself to see a heart
The system is built around three views that carry the most clinical weight, the apical two chamber view, the apical four chamber view, and the short axis mid view. For each view, the pipeline runs through a repeating pattern, generate a rough starting label using classical computer vision and known heart geometry, train a neural network on the images that pass a quality check, use that trained network to label more images than it started with, then train a second, better network on the expanded and cleaner set of labels.
For the apical two chamber view, the starting point is watershed segmentation, a decades old computer vision technique that floods an image from seed points to find region boundaries. Those rough outlines go through quality control based on shape descriptors such as size and eccentricity, discarding anything that does not look plausibly like a heart chamber. The surviving labels train a first UNet, a convolutional network architecture originally built for biomedical image segmentation that has become something close to a default choice in the field. Training is deliberately stopped early, at a point the authors call the elbow of the validation loss curve, because deep networks tend to fit clean signal first and only start memorizing noisy or wrong labels later in training. Catching that elbow before memorization sets in is what lets the network learn from imperfect weak labels without absorbing their mistakes.
Once that first network exists, it gets used to label the rest of the unlabeled training pool, a step the authors call self learning. The newly labeled images become the training set for a second UNet, which becomes the final apical two chamber model. The apical four chamber pipeline builds on top of that first model rather than starting from scratch. It runs the apical two chamber network on four chamber images, which naturally produces two left atrium and two left ventricle predictions per image, then reassigns those into four proper chamber labels and applies clinically guided morphological adjustments, including stretching the right ventricle apex to match known length relationships between the right and left ventricle. The short axis view starts from the crudest label of all, a simple circle found through Hough circle detection, then adds a holistically nested edge detection network to sharpen the boundary before the same early learning and self learning cycle produces a final model.
Why this matters
None of the individual computer vision tricks here are new. Watershed segmentation, Hough circles, and edge detection all predate deep learning by decades. What is genuinely clever is using them only as a rough first draft, then letting a neural network with early stopping and self labeling clean up and generalize past their mistakes, so the final system depends on none of them being perfect on their own.
Reading the loss curve instead of trusting the labels
The early learning idea deserves a closer look because it is doing real work here. Deep networks trained on data that contains some wrong labels tend to go through two phases. Early in training they fit the correctly labeled examples first, because those examples share consistent, learnable patterns. Later in training, given enough time, they start to memorize the incorrectly labeled examples too, since a large enough network can eventually fit almost anything thrown at it, including noise. The validation loss curve during that first phase typically drops quickly, then bends into something like an elbow shape right around the point where memorization starts to creep in. By monitoring that curve and stopping training right at the bend, the UCSF team captured the benefit of learning from noisy weak labels while dodging most of the cost of trusting them too much.
This is the mechanism that makes the whole self supervised chain trustworthy enough to use. Each stage produces labels that are better than the stage before it, not because any single stage is perfect, but because early stopping keeps every stage from fully absorbing its predecessor’s errors.
The math underneath the segmentation
Two quantities do most of the heavy lifting in how this pipeline is trained and evaluated. The first is the soft Dice loss used to train the UNet segmentation networks, which measures the overlap between a predicted chamber mask and a target mask in a way that stays differentiable for gradient descent.
P is the predicted probability mask, T is the target mask, and the loss the network minimizes is one minus this value.
The second is the standard clinical formula for left ventricle ejection fraction, the single most requested number on any echocardiogram report, computed directly from the pipeline’s own volume estimates at end diastole and end systole.
LVEDV is left ventricle end diastolic volume and LVESV is left ventricle end systolic volume, both computed using the biplane method of discs from the pipeline’s segmented chamber outlines.
Systole and diastole frames were not chosen by a clinician for the AI comparison either. The pipeline plots the segmented chamber area across every frame of a video, fits a sinusoid matched to the patient’s heart rate, and picks the video and frame combination that fits that periodic pattern best. That automatic step failed on less than two percent of the dataset, at which point diastole and systole were chosen manually as a fallback.
What happened when the pipeline met 18,423 real patients
Training stayed small on purpose, just 450 echocardiograms contributing 93,000 images across the three views. Testing was a different story entirely. The holdout set covered 8,393 echocardiograms from UCSF representing 4,476,266 individual images, spanning every image quality level and every pathology present in the clinic, since the authors deliberately excluded nothing for being technically difficult or unusual. A subset of 553 of those patients also had a cardiac MRI on file within 30 days, which let the team compare pipeline output not just to clinical echocardiogram readings but to the actual gold standard imaging modality for cardiac measurements. On top of all of that, an external public dataset called EchoNet Dynamic added another 10,030 patients and 20,060 apical four chamber images that the UCSF model had never seen during development.
| Measurement | Correlation with clinical echo (r squared) | Bland Altman bias and limits of agreement |
|---|---|---|
| LV end diastolic volume | 0.70 | 2.8 plus or minus 51 mL |
| LV end systolic volume | 0.82 | 5.3 plus or minus 32 mL |
| LV ejection fraction | 0.65 | negative 5.3 plus or minus 14.6 percent |
| LV mass | 0.55 | not separately reported here, see full paper |
| Right ventricle end diastolic area | 0.69 | negative 0.86 plus or minus 5.4 cm squared |
| Right ventricle end systolic area | 0.71 | 1.6 plus or minus 3.9 cm squared |
| Left atrial volume | 0.84 | negative 0.15 plus or minus 20 mL |
| Right atrial volume | 0.76 | negative 2.1 plus or minus 21 mL |
Context matters more than any single number in that table. The authors are careful to compare their correlations against what is already known about how much two human clinicians disagree with each other on the same measurements, and against results published for fully supervised deep learning systems trained on manually labeled data. On that comparison, the self supervised pipeline lands in roughly the same neighborhood, occasionally ahead. The reported r squared for ejection fraction, for instance, came out higher here than in at least two previously published supervised approaches the authors cite directly.
When measurements were converted into a simple normal versus abnormal call using standard clinical cutoffs, accuracy ranged from 0.71 for LV mass up to 0.97 for ejection fraction, with an average around 0.85 across all measured chambers. Cohen’s kappa, a stricter statistic that accounts for chance agreement, ranged from 0.54 to 0.79, landing in the moderate to substantial agreement range on the standard interpretive scale. LV mass and right ventricle end systolic area were the exceptions, both landing only in the fair agreement range, a limitation the authors do not try to hide.
Checking the work against cardiac MRI
Cardiac MRI is considered the gold standard for chamber measurement precisely because it avoids the geometric assumptions and acoustic window limitations that ultrasound is stuck with. Comparing the 553 patients who had both an echocardiogram and an MRI on file gave the researchers an honest benchmark. Clinical echocardiogram readings themselves only correlated with MRI at an r squared between 0.67 and 0.77 for LV size and function, with echocardiography systematically underestimating both diastolic and systolic volume compared to MRI, a well documented pattern in the cardiology literature that has nothing to do with AI.
The self supervised pipeline compared to MRI came out similar to slightly weaker than that clinical benchmark, with r squared values between 0.60 and 0.73 for LV size and function. LV mass again showed the largest gap, correlating with MRI at only 0.42, worse than the already modest 0.35 correlation between clinical echo and MRI on the same measurement. That is a meaningful caveat rather than a footnote, and it lines up with a broader pattern across cardiology research that LV mass estimated from two dimensional echocardiography, whether by a human or a machine, tends to disagree with three dimensional MRI more than volume or function measurements do.
Testing on data the model had never touched
The EchoNet Dynamic external dataset offered something the internal test set could not, manual tracings of the left ventricle made by an entirely different research group using different equipment. Against those independent tracings, the pipeline’s left ventricle segmentation reached an average Dice score of 0.89, with a reported 95 percent confidence interval that rounded to the same 0.89 given how large the test set was. For comparison, the paper notes that Dice score agreement between two different human annotators tracing the same left ventricle on ultrasound typically falls between 0.82 and 0.93 in published work. An automated system landing inside that human to human range, on data it never saw during development and using labels it never had access to during training, is a genuinely strong result.
Ejection fraction estimated from the external dataset using only the apical four chamber view, since no apical two chamber images were available there, reached 0.79 accuracy for the simple normal versus abnormal classification. That number is lower than the 0.97 seen internally, which is a useful reminder that estimating a full clinical measurement from a single view is a harder task than segmenting a chamber boundary, even when the underlying segmentation itself is strong.
The clinical translation gap
A Dice score of 0.89 on a public benchmark and a strong r squared against clinical readings are genuinely good research results. Neither one is the same thing as a system ready to sit inside a hospital workflow, and the authors are upfront about that distance. A few gaps stand between this pipeline and actual clinical deployment. First, the model was trained and largely tested on data from a single academic medical center, UCSF, using mostly Philips ultrasound machines, with GE and Siemens machines making up a smaller share. Ultrasound image characteristics differ meaningfully between manufacturers, and the external EchoNet dataset used only Philips equipment as well, so cross vendor generalization beyond what was tested here remains an open question.
Second, LV mass and right ventricle measurements, two of the weaker performing categories in this study, are also two of the measurements clinicians already trust the least due to known reproducibility problems, which means any AI system inheriting that same weakness would need extra caution before being used to flag abnormal right heart or mass findings in practice. Third, a system like this would need prospective validation, meaning testing on new patients going forward in real time rather than on archived retrospective data, along with regulatory clearance processes that specifically address how an AI measurement tool integrates into clinical decision making, before it could responsibly influence patient care. None of that is a knock against the research. It is simply the normal, necessary distance between a strong peer reviewed paper and a tool a cardiologist can rely on at the bedside.
Regulatory and safety notes
The paper itself makes no claim of regulatory clearance, and nothing about this pipeline has gone through the Food and Drug Administration review process or an equivalent international pathway as described in the publication. Any future clinical product built on these methods would need to go through that process, likely as software intended to assist rather than replace a qualified reader, given how current AI enabled measurement tools in cardiology are typically classified. Readers should treat this work as an important research advance in how segmentation models can be trained, not as a description of an available clinical product.
What this means beyond one paper
The scaling argument here is the part most likely to matter beyond cardiology. The authors estimate, based on timed manual annotation of a small sample, that manually labeling every chamber in all three views across their 450 training studies would have taken a human 1,664 hours. Their pipeline needed zero of those hours and still scaled up to producing automatic measurements across more than 18,000 test studies, a number that plainly outstrips what any team of human annotators could reasonably produce. The authors also point out that human sonographers typically need roughly 100 studies of hands on experience to become proficient, meaning their 450 study training set is not far off from a human learner’s own efficiency, while the resulting system’s throughput is not remotely comparable to a human’s.
There is also a completeness argument buried in these results that is easy to miss. Real world echocardiogram archives, including both the internal UCSF dataset and the external EchoNet dataset used here, are missing large numbers of manual labels, and not randomly. The right heart and left atrium get skipped far more often than the left ventricle simply because tracing them takes more clinician time for measurements considered lower priority. A pipeline that segments all four chambers simultaneously, the way this one does, sidesteps that selective gap entirely. The external dataset only had manual left ventricle tracings available, yet the pipeline still produced predictions for all four chambers on every image, filling in exactly the kind of coverage gap that manual labeling tends to leave behind.
The bigger picture
If this general approach generalizes, and the authors argue it should transfer to other anatomical structures and other ultrasound applications relatively quickly, the interesting implication is not just cheaper AI development. It is the possibility of imputing consistent measurements across archives that were never fully labeled in the first place, at a granularity down to individual frames rather than just the handful of frames a clinician happened to measure.
Honest limitations of the study
Sample size context matters here. The 450 training studies are small by modern deep learning standards, though the authors argue convincingly that this is closer to a strength than a weakness given how much larger the resulting test set is and how the comparison to human learning proficiency holds up. The bigger concern is dataset composition. Both the internal UCSF cohort and the external EchoNet cohort are enriched for cardiac disease relative to the general population, which is typical for academic medical center data but means performance in a lower risk primary care population has not yet been demonstrated and the authors say as much directly.
Demographic and equipment representation is another real constraint. The training and validation set skewed toward Philips machines at 74 percent, with GE and Siemens machines making up smaller shares, and the external test set used Philips exclusively. Race and ethnicity breakdowns in the paper’s demographic table show meaningful differences between the training set and the larger all comers test set for some groups, differences the authors themselves flag as statistically significant even while noting that with a dataset this large, even small and clinically trivial differences tend to reach statistical significance. LV mass and right ventricle measurements remain the clearest weak points across every comparison in the paper, whether against clinical echocardiogram readings or against MRI, and any future work building on this pipeline would need to treat those two categories with real caution rather than assuming uniform reliability across every chamber measurement.
Finally, the frame selection method used to pick systolic and diastolic timepoints, while clever, is itself an approximation that failed on nearly two percent of cases and required manual correction. The authors note this honestly as a source of potential disagreement with a clinician who might select a slightly different frame for their own measurement, even when the underlying segmentation between AI and human agrees almost perfectly frame for frame.
A reproducible implementation you can actually run
The full training pipeline described in the paper relies on custom infrastructure, clinical shape priors, and a large private dataset that cannot be reproduced outside a hospital system. What follows is a simplified, fully runnable PyTorch implementation of the core learning components the paper describes, a UNet segmentation network trained with soft Dice loss, an early learning style training loop that tracks the validation loss curve to catch the elbow point described in the paper, and a lightweight self training step that uses a first trained model to generate pseudo labels for additional unlabeled data before a second model is trained on the combined set. It is meant as an educational reference for the general technique, not a reproduction of the clinical results above.
Run that file directly and it trains two small UNets on synthetic circular labels in well under a minute on a laptop CPU, printing a validation Dice score at the end, which confirms the early stopping and pseudo labeling logic actually executes correctly before anyone points it at real ultrasound data.
Conclusion
The core achievement here is narrower than it might first sound and more useful because of that narrowness. This is not a claim that AI can read an echocardiogram unsupervised in some general sense. It is a demonstration that a specific, carefully engineered chain of classical computer vision, clinical shape knowledge, early stopping, and self training can replace manual chamber tracing for a well defined segmentation task, and that the resulting measurements hold up against clinical readings, against MRI, and against an independent public dataset at levels that are genuinely comparable to human performance.
The conceptual shift worth sitting with is the reframing of self supervision itself. Photographic self supervised learning usually relies on the image alone, predicting a masked patch or contrasting augmented views. This pipeline instead treats domain knowledge, the fact that a right ventricle has a known length relationship to the left ventricle, the fact that chamber shapes follow predictable geometric bounds, as a legitimate substitute for a human label. That is a template other medical imaging problems could borrow directly, since most areas of medicine carry exactly this kind of structured domain knowledge that current self supervised methods rarely exploit.
Whether this transfers cleanly to other organs or other imaging modalities is genuinely unknown rather than assumed. The authors are explicit that their next steps involve extending to other anatomic structures and other ultrasound types, and there is real reason for optimism given how modular the pipeline already is, weak label generation, early learning, self learning, repeated per structure. But every domain carries its own version of the RV to LV length prior used here, and finding those priors for a new organ is real, unglamorous work that cannot be assumed away.
The honest remaining limitations are not small. LV mass and right ventricle measurements underperformed relative to left ventricle volume and function across every comparison in the paper, a single center and largely single vendor dataset leaves open questions about generalization, and nothing here has gone through the regulatory process that would let it touch a real patient’s chart. Future directions the authors point toward, frame by frame measurement at a granularity no human reader could match, and application to additional anatomical structures, both sound genuinely achievable given what this paper already demonstrates, but achievable is not the same as done.
What lingers after reading this paper is not the specific Dice score or the specific correlation coefficient. It is the reminder that the biggest constraint on medical AI has rarely been algorithms. It has been the human labor required to teach those algorithms in the first place, and this paper is a genuinely careful attempt to make that labor optional rather than mandatory, at least for one well chosen corner of cardiology.
Frequently asked questions
What does self supervised mean in this context
It means the neural networks never trained on a human drawn outline of a heart chamber. Instead, the training labels came from classical computer vision techniques combined with known anatomical relationships between chambers, refined across several rounds of training using early stopping and self generated pseudo labels.
Is this AI system used in hospitals right now
No. This is a research pipeline described in a peer reviewed paper, and the authors make no claim of regulatory clearance or clinical deployment. Any use in actual patient care would require prospective validation and a formal regulatory review process first.
How accurate is the AI compared to a human cardiologist
For most chamber measurements, the correlation between the AI pipeline and clinical echocardiogram readings fell within the range typically seen when two different clinicians measure the same study, according to the comparisons the authors made against published inter observer variability studies. Left ventricle mass and right ventricle measurements were the exceptions, showing weaker agreement in both the AI system and, historically, between human readers as well.
What is a Dice score and why does 0.89 matter
Dice score measures how much a predicted outline overlaps with a reference outline, on a scale where 1.0 is a perfect match. The pipeline reached 0.89 for left ventricle segmentation on an external public dataset with independent manual tracings, which the paper notes sits inside the 0.82 to 0.93 range typically reported when two different human experts trace the same structure.
Which heart chambers did the pipeline measure
All four main chambers, the left ventricle, right ventricle, left atrium, and right atrium, across three standard echocardiogram views, the apical two chamber, apical four chamber, and short axis mid views.
Where can I read the full study
The complete paper, titled Self supervised learning for label free segmentation in cardiac ultrasound, was published in Nature Communications in April 2025 and is openly available through the journal at the link in the box below.
Read the original research
Every number in this piece traces back to the peer reviewed paper by Ferreira, Lau, Salaymang, and Arnaout, published in Nature Communications.
For readers who want to see the underlying computer vision techniques this pipeline builds on, our explainer on how UNet architectures work in medical imaging covers the base architecture in more depth, and our piece on weak supervision and pseudo labeling explained walks through the self training pattern used across several stages of this pipeline. Readers interested in the broader pillar can start from our AI for medical imaging and healthcare hub for the full cluster of related coverage.
Source. Ferreira, D. L, Lau, C, Salaymang, Z, and Arnaout, R. Self supervised learning for label free segmentation in cardiac ultrasound. Nature Communications 16, 4070 (2025). https://doi.org/10.1038/s41467-025-59451-5. Received November 12, 2024. Accepted April 23, 2025. Published April 30, 2025. Funding acknowledged in the original paper from the National Institutes of Health grant R01HL150394, the Department of Defense grant PR181763, and the Chan Zuckerberg Biohub. The authors declared no competing interests.
This analysis is based on the published paper and an independent evaluation of its claims.
Pingback: 6 Groundbreaking Innovations in Diabetic Retinopathy Detection: A 2025 Breakthrough - aitrendblend.com