
- Human activity recognition
- Wearable sensors
- Activities of daily living
- Deep learning
- Support vector machine
- LSTM and GRU
- OPPORTUNITY dataset
- CogAge dataset
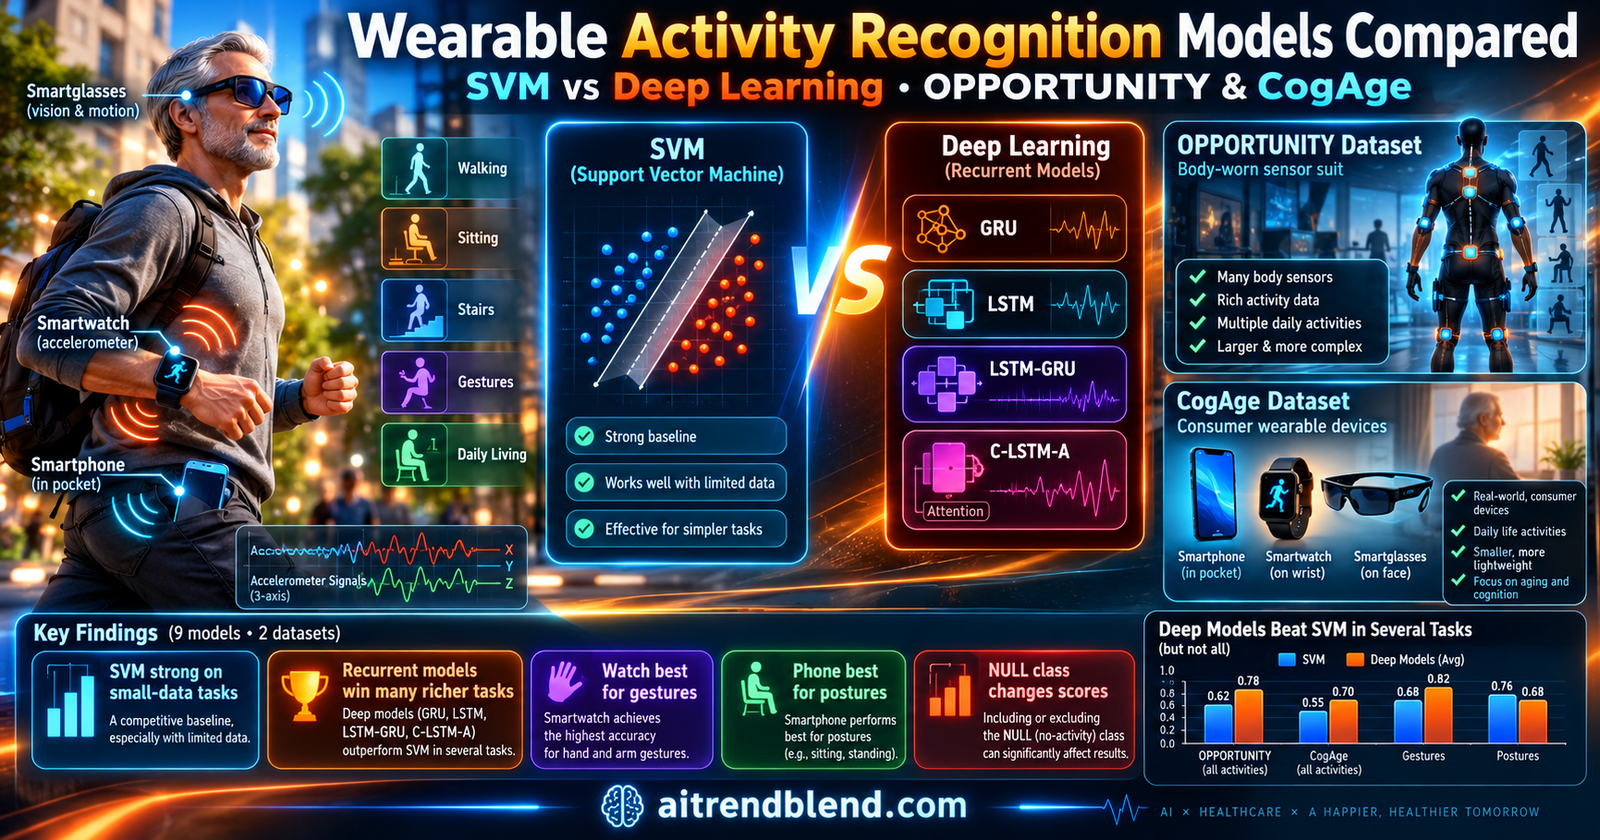
Picture an older woman who lives alone and is frail but fiercely independent. Her nearest relative is hours away. Her doctor would love to know whether she still climbs her stairs each day, whether she sits more than she did last spring, whether she has stopped making her usual trips to the kitchen. A watch on her wrist and a phone in her pocket already record the raw motion signals that could answer those questions. The hard part is turning that stream of numbers into labels a clinician can trust. A team centred at the University of Luebeck, with colleagues at the University of the Punjab, has now put nine recognition methods through the same two benchmarks, and what they found is messier, and more useful, than the usual story that deep learning wins.
Key points
- The study pits a linear SVM using 18 hand crafted features per sensor channel against eight neural networks on two public datasets, and averages ten runs for each network.
- For simple state activities such as standing, walking, sitting and lying, almost every model scores well, and the SVM leads on two of the six state tasks.
- For behavioural activities such as opening a drawer, deep recurrent models led on four of six tasks by 5.41 to 9.24 points, while the SVM led on two CogAge tasks by 2.87 and 0.72 points.
- The NULL class makes up 72.28% of the OPPORTUNITY behavioural windows, and it can inflate weighted scores while hiding poor recognition of the activities that matter.
- On CogAge, the phone alone was the best single device for postures and walking, and the watch alone was best for gestures. No pair of devices was tested.
- Training and test data come from the same people in both datasets, so none of the scores describe how a system would treat a new patient.
Why activity recognition keeps turning up in geriatric research
Frailty is the most prominent geriatric syndrome. It is a gradual, age related decline across the body’s physiological systems that leaves a person less able to absorb a shock such as a fall or an infection. The authors lean on a study covering eleven European countries that linked dependence on care with high societal costs. Dependence in activities of daily living, along with limited mobility caused by fear of falling, are described there as potentially modifiable factors. That word modifiable is the hook. If something can be changed, it is worth measuring.
Measuring is where wearables come in. Phones, watches and glasses all carry accelerometers and gyroscopes, and they generate large volumes of time series data without asking the wearer to do anything unusual. The paper lists remote monitoring, accident prevention, health related quality of life assessment and rehabilitation support as the benefits healthcare could draw from automatic recognition of daily activities.
Building such a system follows what the field calls the activity recognition chain. Raw data is collected, cleaned, cut into segments, converted into features, and finally classified. The authors concentrate on the last two links. Features can be designed by hand, with experts choosing statistics such as the minimum, maximum, skewness, kurtosis, spectral energy and entropy of each signal. Or they can be learned directly from the raw signal by a neural network. The study is, in effect, a long argument between those two philosophies, run across datasets that differ sharply in how many sensors they use.
This piece sits inside our healthcare AI coverage, so if you want the wider context, the AI for medical imaging and healthcare hub collects related analyses. The motion sensors here are a long way from MRI scanners, but the questions about evidence, generalization and clinical readiness turn out to be remarkably similar.
What the researchers actually tested
The paper is a comparative study published open access in Neurocomputing in July 2025. Its authors come from the Institute of Medical Informatics and the Section for Clinical Research IT at the University of Luebeck, the University of the Punjab, expandAI and the Fraunhofer IMTE. The German Federal Ministry of Education and Research funded the work.
Two datasets that have little in common
OPPORTUNITY is a sensor rich benchmark. Four subjects wore seven inertial measurement units and twelve triaxial accelerometers spread across the arms, back, hips and feet, producing 145 channels at 30 Hz. The authors discarded 38 channels that suffered heavy data loss and filled the remaining gaps in the other 107 by carrying forward the last observed value. The recordings include structured daily living runs and a drill run designed to produce many short activity instances. There are four state activities, which are stand, walk, sit and lie. There are 17 behavioural activities, such as opening and closing doors, fridges, dishwashers and drawers, cleaning a table, drinking from a cup and toggling a switch. Each task also carries an extra NULL class for everything else, which brings the totals to five and 18 classes. Training uses the first three daily living runs plus the drill run, and testing uses the fourth and fifth daily living runs.
CogAge goes the opposite way. Eight subjects wore only three consumer devices, a smartphone in the front left pocket, a smartwatch on the left arm and smartglasses on the head. The dataset holds six state activities (bending, lying, sitting, squatting, standing and walking) and 53 behavioural ones. The phone samples at 200 Hz, the watch at 67 Hz and the glasses at 20 Hz. To combine them, the authors resampled everything to 200 Hz. They also tried the opposite, shrinking everything to 20 Hz, but scores dropped, which they put down to information loss. Training uses the first recording session and testing uses the second.
The size gap is dramatic. By the authors’ count OPPORTUNITY is more than 600 times larger for state classification and at least 20 times larger for behavioural classification, which matters a great deal when you ask neural networks to compete with simpler methods.
| OPPORTUNITY | CogAge | |
|---|---|---|
| Sensors | 7 inertial units and 12 triaxial accelerometers on the body | Smartphone, smartwatch and smartglasses |
| Sampling | 30 Hz, 107 usable channels after cleaning | 200 Hz phone, 67 Hz watch, 20 Hz glasses, all resampled to 200 Hz |
| Subjects | 4 | 8 |
| State classes | 4, plus NULL | 6 |
| Behavioural classes | 17, plus NULL | 53 |
| Train and test | Three daily living runs and the drill run for training, two daily living runs for testing | First session for training, second session for testing |
| Windowing | 64 timesteps (about 2 seconds), stride of 3 | Four second segments |
The nine contenders
The baseline is a linear SVM. For every sensor channel and every window, the authors computed 15 statistical features and three frequency related ones, then joined them into one vector whose length is 18 times the number of channels. For OPPORTUNITY that works out to 1,926 numbers per window. Each feature was scaled to the range zero to one, and the penalty parameter C was searched over powers of two between two to the power of minus six and two to the power of six.
The eight networks receive the raw windows after z score normalisation. There is a three block CNN, a GRU, an LSTM, a hybrid that runs convolutions over short sub sequences before an LSTM (C-LSTM), a stacked LSTM and GRU model (LSTM-GRU), an LSTM with an attention layer (LSTM-A), a convolutional LSTM with attention (C-LSTM-A), and a Transformer. That Transformer is a modest one, with a single encoder block and a single attention head of size 50.
Each value x is rescaled by the mean and standard deviation of its signal, so channels with large raw values do not dominate the ones with small values.
The form used by the Transformer. Queries Q are compared with keys K, the scores are scaled by the square root of the key dimension, and the resulting weights mix the values V.
Each network was trained ten times and the tables report the mean. The SVM ran once, since it converges to the same answer every time, and the Transformer ran only once on OPPORTUNITY because training took so long and its results were weak. The headline metric is average F1, which gives every class equal weight. The paper also reports accuracy, mean average precision and area under the curve.
True positives, false positives and false negatives are counted per class and the per class F1 scores are averaged without any weighting by class size.
Equal weight per class is a deliberate choice, and it turns out to matter enormously, as the next section shows.
What the numbers show
OPPORTUNITY, where a full body sensor suit is allowed
Here is the best deep model on each task, set against the SVM.
| Task | Best deep model | SVM | Who leads |
|---|---|---|---|
| State, with NULL | LSTM-GRU, 91.89 | 90.10 | Deep model by 1.79 points |
| State, without NULL | GRU, 94.60 | 94.73 | SVM by 0.13 points |
| Behavioural, with NULL | LSTM-GRU, 71.71 | 63.76 | Deep model by 7.95 points |
| Behavioural, without NULL | GRU, 79.91 | 74.50 | Deep model by 5.41 points |
For state activities without the NULL class, nothing separates the models. Scores sit between 94.10% and 94.73%, and the SVM tops the list with the GRU 0.13 points behind. The authors read this as evidence that 18 simple features describe walking and sitting about as well as a trained network. Hard to argue with that.
Add the NULL class back and the picture shifts a little. The LSTM-GRU takes first place at 91.89%, ahead of the SVM at 90.10%. The confusion matrices show where the gain comes from. Of the 17,838 windows whose true label was NULL, the SVM got 14,577 right and the LSTM-GRU got 15,793, which is roughly 82% against 88.5%. The gain is not free, though. The LSTM-GRU labelled 2,838 of 17,796 walking windows as standing, against 2,276 for the SVM. If the question were about mobility rather than idle time, that trade would look worse.
The most dramatic swing belongs to the small Transformer. It scored 77.47% on state activities with the NULL class and 94.41% without it, a jump of nearly 17 points, while the LSTM-GRU moved by less than three. That was a single run, so the exact figures deserve caution, but the direction suggests this model copes poorly with a dominant background class.
Behavioural activities and the weighted score trap
Behavioural activities are where the models actually part ways. With the NULL class included, the LSTM-GRU leads at 71.71% and the LSTM follows at 71.56%, while the SVM sits at 63.76%. Remove NULL and the GRU leads at 79.91% against 74.50% for the SVM. The CNN and the Transformer trail badly in both settings.
Why does the paper insist on average F1 rather than the weighted F1 used in earlier benchmark papers? Try a quick calculation. Suppose a lazy classifier labels every behavioural window as NULL, and suppose NULL makes up 72.28% of the windows, as it does across the dataset. That classifier earns a weighted F1 of about 0.61 and an average F1 of about 0.05. The first number looks respectable and the second tells the truth. Earlier work on this benchmark reported a one nearest neighbour classifier at 87 weighted F1 with NULL and 55 without it, a gap the authors attribute to exactly this inflation.
The without NULL numbers deserve a warning of their own. Dropping NULL removes roughly 72% of the behavioural windows and turns the task into one where something of interest is always happening. The SVM climbs from 63.76% to 74.50% and the GRU from 69.85% to 79.91%, but a home monitoring system never gets to know in advance that an activity is under way. Those scores describe the second stage of a system, after some other component has already decided that something worth labelling occurred. The authors point toward hierarchical designs for this reason, with a first stage that separates NULL from activity and a second stage that names the activity.
Where the models stumble tells its own story. Opening the fridge gets mistaken for closing it, opening door 1 for closing door 1, and the same happens in reverse. Reciprocal actions produce very similar motion. The 18 hand crafted features were not fine enough to separate them as well as a recurrent network could, especially for the drawers and the dishwasher.
CogAge, where only three consumer devices are allowed
| Task | Best deep model | SVM | Who leads |
|---|---|---|---|
| State, all devices | C-LSTM-A, 96.48 | 94.76 | Deep model by 1.72 points |
| Behavioural, all devices | LSTM-A, 66.36 | 69.23 | SVM by 2.87 points |
| State, smartwatch | C-LSTM, 69.62 | 64.92 | Deep model by 4.70 points |
| Behavioural, smartwatch | LSTM-GRU, 64.67 | 55.43 | Deep model by 9.24 points |
| State, smartglasses | LSTM-GRU, 70.57 | 70.74 | SVM by 0.17 points |
| Behavioural, smartglasses | LSTM-GRU, 45.97 | 37.69 | Deep model by 8.28 points |
| State, smartphone | C-LSTM-A, 87.06 | 85.51 | Deep model by 1.55 points |
| Behavioural, smartphone | C-LSTM-A, 34.20 | 34.92 | SVM by 0.72 points |
With all three devices combined, hybrid models take the top three places on state activities. The C-LSTM-A scores 96.48%, the LSTM-A 96.30% and the C-LSTM 95.54%, with the SVM at 94.76%. The plain LSTM manages 90.42% and the plain GRU 91.17%. On a small dataset of postures, adding convolution, attention or both seems to help.
Behavioural activities flip the script. The SVM leads at 69.23%, and the best neural network, the LSTM-A, reaches 66.36%. The plain LSTM drops to 51.45% and the Transformer to 49.59%. With 53 classes and only eight subjects, the networks have little to learn from.
There is a reference point worth knowing. The paper’s own summary of earlier work shows the dataset’s original authors reporting a multichannel deep network at 71.72% on behavioural activities using the same split, and 76.07% once transfer learning was added. No model in this comparison matches either number. The lesson may be that a purpose built architecture, or pretraining on a related dataset, buys more than swapping one off the shelf layer type for another.
One device or three?
| Setting | State activities | Behavioural activities |
|---|---|---|
| Smartphone alone | 87.06 (C-LSTM-A) | 34.92 (SVM) |
| Smartglasses alone | 70.74 (SVM) | 45.97 (LSTM-GRU) |
| Smartwatch alone | 69.62 (C-LSTM) | 64.67 (LSTM-GRU) |
| All three devices | 96.48 (C-LSTM-A) | 69.23 (SVM) |
The ranking reverses between the two task types. For postures and walking, the phone in the pocket is far ahead of the watch and the glasses. For gestures, the watch leads by a wide margin, which makes physical sense since the hand is where the action happens. Using all three devices gave the best overall scores in both cases.
The per activity chart is more interesting than the averages. The phone alone recognised walking with an F1 of 100%, slightly better than the 98.92% from all devices together. Sitting is the opposite case. The watch managed 57.44% and the glasses 42.69%, while the phone reached 80.39% and the combined system 93.61%. A plausible reading, and it is only our reading, is that a phone in a trouser pocket rides on the thigh and feels the change in leg orientation when someone sits, whereas a wrist or a head moves far less.
One gap deserves flagging. The authors close by suggesting that future systems pair the phone for postures with the watch for gestures, but they never trained a two device model. The study tests each device alone and all three together, so the phone plus watch idea remains a hypothesis.
SVM versus deep learning, counted honestly
The paper’s first research goal asks how deep networks compare with the SVM. Its discussion answers that the SVM can still rival or beat deep models in certain scenarios, while deep learning wins on larger datasets and richer tasks. That is fair, and it hides a lot of structure. Here is our own tally from the paper’s tables.
“SVMs with HC features can still rival or even outperform DL models”Ciortuz and colleagues, Neurocomputing, 2025
Across the twelve tasks, the best deep model beat the SVM in eight and lost in four. That sounds like a win for deep learning until you notice the comparison is the best of eight networks against one SVM. Count every pairing of a network and a task instead and there are 96 of them. A network came out ahead of the SVM in 36 of those 96.
The 36 are not spread evenly. The CNN and the Transformer never beat the SVM, not once in twelve tasks. The six recurrent models won exactly 36 of their 72 pairings. The two convolutional hybrids did best, with the C-LSTM and the C-LSTM-A each beating the SVM in eight of twelve tasks, while the plain LSTM managed three, all of them on OPPORTUNITY. So the real question is not whether deep learning beats classical learning. It is which deep architecture, on which kind of task, with how much data.
Two caveats cut in opposite directions. The paper reports means only, with no standard deviations, so gaps below a point cannot be ranked with confidence. The 91.89% against 91.82% race between the LSTM-GRU and the GRU is a good example. At the same time, the appendix shows several recurrent models tuned over ranges of cell sizes, dropout rates and dense layer widths, while the CNN and the Transformer have almost fixed settings. A CNN reported by Li and colleagues on the same OPPORTUNITY split reached 65.26% on behavioural activities with the NULL class, nearly eight points above the 57.34% here. Some of the CNN’s poor showing may therefore reflect configuration rather than architecture.
The same table of earlier work helps put the best results in perspective. The SVM baseline here scores 63.76% on behavioural activities with NULL, the same figure Li and colleagues reported for it on that split in 2018. The best network now reaches 71.71% against their best hybrid at 70.86%. A gain of under one point over the 2018 result is a useful reminder of how much of the benchmark’s difficulty comes from the data rather than the model.
A few numbers that do not line up
Reading the paper closely turns up several small inconsistencies. None of them changes the broad story, but anyone planning to reuse the figures should know about them.
- The CogAge section describes the SVM behavioural score as 69.93%, while Table 5 of the paper and the abstract give 69.23%. We use 69.23%.
- The discussion quotes an SVM advantage for the smartphone behavioural task that is printed as 038%, while the tables give 34.92% against 34.20%, a gap of 0.72 points.
- The CNN state rows in the smartglasses and smartphone tables carry identical values, 66.41, 66.66, 67.83 and 89.34, even though other smartphone models score far higher. That could be a copy error, and it is worth confirming with the authors before reusing those cells.
- The abstract gives a state recognition range of 94.10% to 96.48%, but the best state score on OPPORTUNITY with the NULL class is 91.89%, which falls outside that range.
- The device ranking in the discussion quotes 59.52% for the smartwatch on behavioural activities, which is the C-LSTM-A score, while the best smartwatch result in Table 6 is 64.67%. The ranking of devices stays the same either way.
From benchmark to bedside
The clinical translation gap
Every score above comes from a setup where the same people appear in both training and test data. The authors say so plainly, and they followed earlier studies in doing it. For a researcher comparing architectures the choice is sensible. For a clinic it is a trap, because a deployed system meets each new patient cold. Gait, posture and the way someone opens a drawer vary from person to person and shift with frailty, with a walking aid, with a bad day. A model that has already seen a person’s style can look far better than one meeting that person for the first time.
The participants raise a second question. The paper motivates its work with frailty in older adults but does not say whether any participants were older adults, or what their health status was. OPPORTUNITY used structured sequences and a drill run in a sensor rich setting, and the activity lists contain nothing a geriatrician would call a clinical event. There are no falls among the classes, no near falls, and no measure of walking speed.
Wearability is a third gap, and the authors raise it themselves. A sensor suit like the OPPORTUNITY rig would never survive daily life, and wearing a phone, a watch and glasses at once may not suit older users either. The compute question is mostly unanswered. The networks were trained on four V100 GPUs, and the paper reports no inference latency, memory use or battery drain, even though it frames computational demand as part of the trade off.
Error costs are the last piece. A monitor that mislabels roughly one in six walking windows as standing, which is what the LSTM-GRU did on OPPORTUNITY, may be tolerable for a casual fitness feature and unacceptable if clinicians use it to track recovery after surgery. For a related example of how a team tackled scanner related shift in imaging, see our analysis of counterfactual contrastive learning for mammography and chest X ray. The same logic applies to wearables once devices from different makers enter the picture.
Regulatory and safety notes
A benchmark result is not a regulatory clearance. Software that informs clinical decisions can be treated as a medical device in many jurisdictions, with evidence requirements well beyond a comparison of F1 scores. Anyone planning a clinical deployment should involve regulatory and clinical safety expertise early.
What a careful pilot would add
These are our suggestions, not the paper’s. Hold out entire people during evaluation rather than entire sessions. Recruit participants who resemble the intended patients, including people who use walking aids. Test the phone plus watch pairing the authors recommend. Report per class recall alongside average F1, and measure energy and latency on the actual hardware. Remember that stretching a 20 Hz glasses stream to 200 Hz adds no information. And treat the NULL class as the main opponent rather than a footnote.
Choosing a model, a practical reading
Here is how we would translate the evidence into starting points. They are editorial judgements built on the paper’s numbers, not recommendations from the authors.
| Situation | Starting point | Evidence in the paper |
|---|---|---|
| Postures and walking from a phone, modest data | Linear SVM on simple features, then try C-LSTM-A | Phone alone, SVM 85.51 against 87.06 for C-LSTM-A |
| Fine grained gestures, plenty of labelled data | GRU or LSTM-GRU | OPPORTUNITY without NULL, GRU 79.91 against SVM 74.50 |
| Gestures from a wrist worn device | LSTM-GRU | Smartwatch behavioural, 64.67 against SVM 55.43 |
| Many classes, very few subjects | SVM remains hard to beat | CogAge behavioural, SVM 69.23 against 66.36 |
| A large background class | Report average F1 and per class recall, consider a two stage design | NULL is 72.28% of OPPORTUNITY behavioural windows |
| Avoid by default | The basic CNN and the one block Transformer used here | Neither beat the SVM on any of twelve tasks |
For teams that want deep model accuracy on a phone, compression is the natural next step. Our write up of TimeDistill shows how Transformer and CNN teachers can be distilled into a lightweight MLP for time series forecasting. Whether that carries over to activity classification is untested in this paper.
Aligning signals recorded at different rates is its own research problem. Our article on TACAF, which fuses EEG with breathing signals, shows one way of treating it. And on class imbalance, the GPMKLE-Net analysis describes class balanced sampling for a skewed medical grading task. The authors list oversampling and augmentation as future work here, since they did not try either.
Limitations
What the authors acknowledge
The authors are open about several constraints. CogAge covers only eight subjects, which limits generalization and starves the neural networks. All of its recordings use the same consumer device models, so nothing is known about other brands. Their Transformer uses a unidirectional encoder and may need a bidirectional design or pretraining. The SVM relies on only 18 hand crafted features, and a richer feature set might change the picture. They did not examine data augmentation or other remedies for imbalance. And they expect the hybrid models to improve with bidirectional recurrent layers.
Clinical limitations
Sample size comes first. OPPORTUNITY has four subjects and CogAge has eight. The window counts run into the tens of thousands, as the OPPORTUNITY confusion matrices show, but those windows come from a handful of bodies, and neighbouring windows overlap by more than 95% because a 64 step window slides forward by three steps.
Dataset bias comes next. Both datasets were gathered under controlled conditions with fixed device models, and the paper does not describe participants’ ages or health status. The label sets are everyday actions rather than clinical outcomes. The OPPORTUNITY labels are also heavily skewed, with 72.28% of behavioural windows marked NULL.
Generalization is the biggest open question. Training and test data share the same subjects in both datasets, and no leave one subject out experiment is reported. No standard deviations accompany the mean scores. A reader looking for evidence that these models would work for a new patient, in a new home, with a new device, will not find it here, and the authors do not claim it.
Where this leaves us
The core achievement of this study is a side by side comparison that most benchmark papers skip. Nine models, twelve tasks, ten runs per network and a deliberate split between state and behavioural activities give practitioners something they can actually consult when picking a method for a given job.
The conceptual shift is away from asking which model is best. On simple postures, a linear classifier on 18 summary statistics is nearly indistinguishable from a trained network. On fine grained gestures with plenty of data, recurrent networks pull ahead. On small datasets with many classes, the humble SVM refuses to lose. The right answer depends on the activity, the sensor budget and the class balance.
The lessons travel beyond activity recognition. Any continuous monitoring problem with a dominant background class may face the same reporting trap, where a headline score flatters a system that mostly predicts nothing interesting. Choosing metrics that give every class a voice is cheap protection.
The limits deserve equal airtime. There are four and eight subjects, no person independent evaluation, no variance estimates, no resource measurements, and a handful of numbers that do not match between text and tables. None of these sink the study. They do keep its conclusions at the level of a careful comparison rather than a deployment guide.
The authors point to bidirectional hybrids, pretraining and transfer learning, data augmentation for imbalance, and real world tests with a variety of consumer devices. We would add person independent evaluation, genuine two device combinations and measured energy cost to that list, because those three decide whether a result in a paper turns into something a frail person can wear for a year.
The wearable on that woman’s wrist already knows what her arm is doing. This study shows that the harder job is deciding how much to trust the label.
Frequently asked questions
Is an SVM still worth using for wearable activity recognition?
Yes, for the right job. In this study a linear SVM with 18 hand crafted features per sensor channel scored highest on OPPORTUNITY state activities without the NULL class and on CogAge smartglasses state activities, and it led on CogAge behavioural activities with all devices and with the smartphone alone. The paper describes it as less computationally demanding than deep models, although it reports no timing figures.
Which deep model performed best?
No single one. The LSTM-GRU hybrid was the best network on five of the twelve tasks, the C-LSTM-A on three, the GRU on two, and the C-LSTM and the LSTM-A on one each. The CNN and the one block Transformer never beat the SVM on any task.
Why did removing the NULL class raise scores so much?
The NULL class is a catch all label for everything the system does not need to recognise, and it makes up 72.28% of OPPORTUNITY behavioural windows. It pulls training toward itself and can resemble real activities, so removing it both rebalances the data and makes the task easier. The resulting scores describe a system that already knows an activity is happening.
Can a smartphone alone recognise everyday activities?
For postures and walking, largely yes in this dataset. The phone alone reached 87.06% average F1 on CogAge state activities and recognised walking with an F1 of 100%. For gestures such as drinking or opening a door, the phone alone managed only 34.92%, while the smartwatch did much better at 64.67%.
Does this research show that wearables can safely monitor older adults at home?
No. The datasets share the same people between training and testing, the paper does not report participants’ ages or health status, none of the activities is a clinical event such as a fall, and no real home deployment was tested. The study compares algorithms. It does not validate a clinical monitoring system.
Why did the CNN and the Transformer score poorly?
The authors note that Transformers usually need large training sets or pretraining, that their own model used a unidirectional encoder, and that LSTM based models cope better with the sequential nature of sensor data. The appendix also shows these two models were tuned over far fewer settings than the recurrent ones, so some of the gap may reflect configuration.
Read the source
The full study is open access. The authors state that their data are available on request.
Citation. Ciortuz G, Hozhabr Pour H, Irshad MT, Nisar MA, Huang X, Fudickar S. Machine learning models for wearable-based human activity recognition: A comparative study. Neurocomputing 650 (2025) 130911. DOI 10.1016/j.neucom.2025.130911.
This analysis is based on the published paper and an independent evaluation of its claims.
Thanks for sharing. I read many of your blog posts, cool, your blog is very good. https://accounts.binance.com/register-person?ref=JW3W4Y3A